Solar Lead ROI: The Cost per Sale Math Installers Should Run
Calculate solar lead ROI with the cost-per-sale formula, worked examples, sensitivity tables and break-even rules, plus when bought leads are worth it.
Updated · 85 min read
In this guide (40 sections)
- What is the formula for solar lead ROI?
- Worked example 1: what does a shared lead really cost per sale?
- Worked example 2: what does an exclusive lead cost per sale?
- Worked example 3: what does a booked appointment cost per sale?
- Worked example 4: how does a live transfer compare?
- Which funnel stage moves cost per sale the most?
- How do you calculate break-even against gross margin?
- How do referrals and lifetime value change lead ROI?
- How does lead ROI change with installer size?
- Are solar leads worth it?
- What benchmarks exist, and why not borrow them?
- What mistakes distort solar lead ROI?
- How should you set up CRM tracking for lead ROI?
- What does a sale really cost once you add labor and credits?
- Where does your funnel leak, and how do you find it?
- How big should a test batch be to judge ROI?
- What go and no-go rules should you set before testing?
- How long does a lead batch take to pay back?
- How do you track lead ROI by cohort?
- What is the most you can pay per lead and still break even?
- How does lead type change ROI once labor is counted?
- What does lead ROI look like for different installer businesses?
- How do you measure ROI on commercial solar leads?
- How do market and state differences change lead ROI?
- How much does closer performance change lead ROI?
- Which setter and confirmation scripts protect lead ROI?
- How should you run a monthly lead ROI review?
- How do you build a lead ROI spreadsheet?
- Which vendor terms change your lead ROI?
- How should you split a lead budget across sources?
- How does seasonality affect lead ROI?
- What should you do when lead ROI drops?
- How do lead ROI goals differ by sales team role?
- Solar lead ROI glossary
- How do bought leads compare with your own marketing on ROI?
- How do battery and add-on leads change the ROI math?
- What does a one-page lead ROI checklist look like?
- How do you explain lead ROI to a partner, lender or investor?
- How do you use the solar lead cost calculator?
- FAQ
Solar lead ROI comes down to one number: what you spend on leads to produce one signed, non-cancelled contract, compared with the gross margin that contract earns. You get that number by dividing the price of a lead by four conversion rates multiplied together: contact, appointment set, sit, and close. Everything else in this guide is either an input to that formula or a decision you make from its output. We define each stage so your numbers mean the same thing week to week, run three worked examples (a shared lead, an exclusive lead and a booked appointment), show which stage moves cost per sale the most, and set break-even rules against margin, including what changed after the 25D residential credit ended. Every example uses clearly labeled illustrative inputs. Published benchmarks from vendors are cited with sources and dates, with a section on why you should build your own baseline instead of borrowing theirs. All of this is as of October 2026.

Key takeaways (as of October 2026)
- Cost per sale = price per lead ÷ (contact rate × appointment rate × sit rate × close rate).
- ROI on leads = (gross margin per job − lead cost per sale − sales labor per sale) ÷ (lead cost per sale + sales labor per sale).
- A 10-point improvement in contact rate usually beats a 10% discount on lead price.
- Bought leads are worth it when lead cost per sale stays below the share of margin you can give to acquisition. Set that share before you buy, not after.
- Use the solar lead cost calculator to run your own inputs.
What is the formula for solar lead ROI?
Solar lead ROI starts with cost per sale: the price of one lead divided by the product of your contact, appointment set, sit and close rates. Subtract that cost and your sales labor per sale from gross margin per job, then divide by the total acquisition cost. A positive result means the lead source makes money; the size tells you by how much.
The formula
Cost per sale = cost per lead ÷ (contact × appointment × sit × close)
Lead ROI = (gross margin per job − acquisition cost per sale) ÷ acquisition cost per sale
where acquisition cost per sale = lead cost per sale + setter and closer labor per sale.
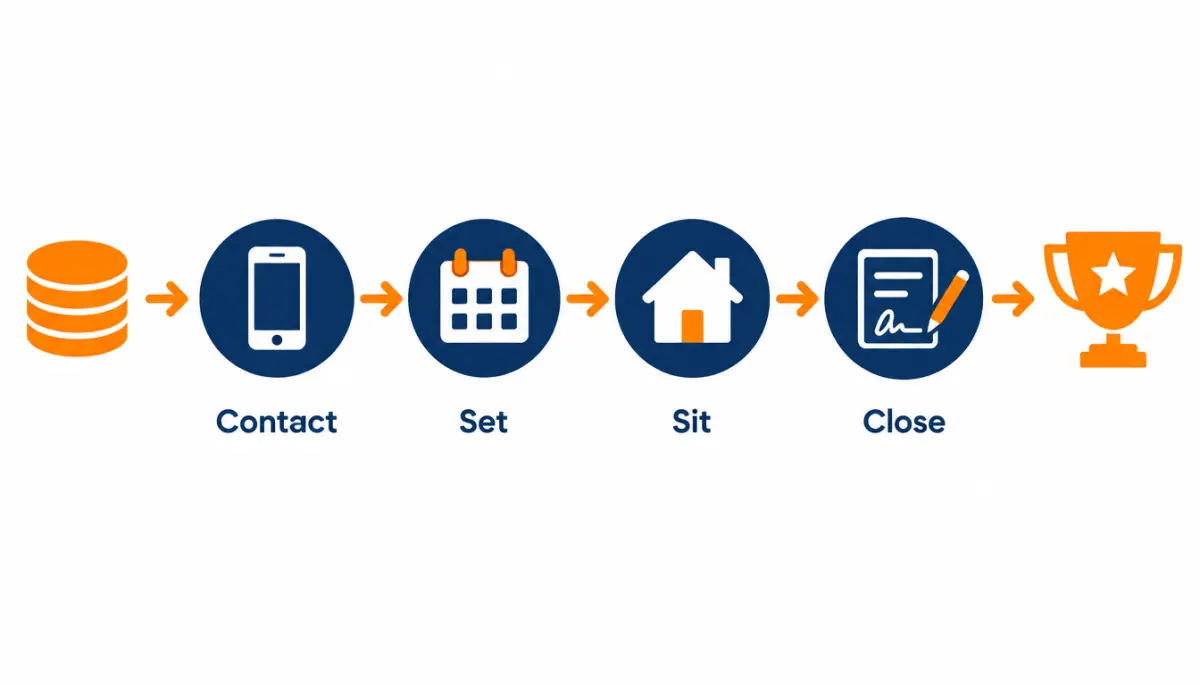
Define each stage
Most published close rates are impossible to compare because nobody says what "close" means. Use these definitions and keep them fixed in your CRM.
| Stage | Rate formula | Counts as success | Does not count |
|---|---|---|---|
| Contact | Leads with a live two-way conversation ÷ leads received | You spoke to the person who submitted the form | Voicemail, text-only reply, wrong person |
| Appointment set | Appointments booked ÷ leads contacted | A specific date and time agreed | "Call me next month" |
| Sit | Appointments held ÷ appointments set | Consultation held with decision makers present | No-show, one spouse only if both decide, rescheduled |
| Close | Contracts signed and not cancelled ÷ appointments held | Contract survives the cancellation window and financing approval | Signed then cancelled, financing declined |
Note the close definition. A contract that cancels in the rescission window or fails financing is not a sale for ROI purposes. Counting it inflates close rates and hides lead quality problems.
Lead-to-sale rate
Multiply the four rates and you get the lead-to-sale rate, the share of leads that become sales. Divide one by it and you get leads needed per sale. If your lead-to-sale rate is 4%, you need 25 leads per sale. At $120 per lead, lead cost per sale is $3,000.
Worked example 1: what does a shared lead really cost per sale?
A shared lead at a low price can cost more per sale than an exclusive lead, because other installers reach the homeowner first and contact and close rates fall. In the illustrative example below, a $45 shared lead produces a lead cost per sale of about $3,571, higher than the exclusive example that follows.
Illustrative example. Inputs are hypothetical, chosen to show the math. They are not benchmarks and not results from any vendor, including us.
| Input | Value | Running result |
|---|---|---|
| Price per lead | $45 | 100 leads cost $4,500 |
| Contact rate | 45% | 45 contacts |
| Appointment rate | 25% | 11.25 appointments |
| Sit rate | 56% | 6.3 sits |
| Close rate | 20% | 1.26 sales |
| Lead cost per sale | $4,500 ÷ 1.26 = $3,571 | |
Why the low sticker price fails
The shared lead loses at every stage, and the losses multiply. Other installers call first, so contact falls. Homeowners who already spoke to two companies agree to fewer appointments. Some book with the first caller and no-show on the rest. At the kitchen table, the homeowner is comparing three quotes, and the lowest price often wins. None of that shows on the invoice, which says $45. All of it shows on the cost per sale. Shared leads can still work; see when shared works for the conditions.
Worked example 2: what does an exclusive lead cost per sale?
An exclusive lead costs more up front but gives your team the homeowner's attention without competitors calling at the same moment, which typically lifts contact and close rates. In the illustrative example below, a $160 exclusive lead produces a lead cost per sale of about $3,110.
Illustrative example. Hypothetical inputs, not benchmarks.
| Input | Value | Running result |
|---|---|---|
| Price per lead | $160 | 100 leads cost $16,000 |
| Contact rate | 70% | 70 contacts |
| Appointment rate | 35% | 24.5 appointments |
| Sit rate | 70% | 17.15 sits |
| Close rate | 30% | 5.145 sales |
| Lead cost per sale | $16,000 ÷ 5.145 = $3,110 | |
At 3.6 times the price, the exclusive lead in this example costs about $460 less per sale. It also uses fewer setter hours, because the team works 100 leads to get 5 sales instead of roughly 400 leads for the same result. Labor is where the gap widens further. Our exclusive solar leads are sold to one company and are never resold, recycled or sold later as aged leads.
Worked example 3: what does a booked appointment cost per sale?
A booked appointment skips the contact and set stages, so cost per sale depends only on price, sit rate and close rate. In the illustrative example below, a $300 appointment with a 70% sit rate and 30% close rate produces a lead cost per sale of about $1,429, before counting any replacement credits.
Illustrative example. Hypothetical inputs, not benchmarks.
| Input | Value | Running result |
|---|---|---|
| Price per appointment | $300 | 20 appointments cost $6,000 |
| Sit rate | 70% | 14 sits |
| Close rate | 30% | 4.2 sales |
| Lead cost per sale | $6,000 ÷ 4.2 = $1,429 | |
Held vs booked
The appointment price is per booked appointment, but you can only close a held one. Your effective price per sit is price ÷ sit rate. At $300 and a 70% sit rate, that is about $429 per sit. Elevarus, a lead vendor, makes the same point in its 2026 buyer framework: no-shows change appointment economics, so compare vendors on cost per sit, not cost per booking.
Replacement terms change this math. If no-shows are replaced, your effective sit rate on paid appointments rises. Our solar appointment setting program states its policy: if a confirmed appointment doesn't sit because the prospect no-shows or doesn't match your filters, report it within 7 days of the scheduled time and we replace it. Read every vendor's version of that sentence closely, because "replacement" can mean very different things.
Comparing the three examples
| Product | Unit price | Units per sale | Lead cost per sale | Setter work needed |
|---|---|---|---|---|
| Shared lead | $45 | 79 | $3,571 | Heavy |
| Exclusive lead | $160 | 19 | $3,110 | Moderate |
| Booked appointment | $300 | 4.8 | $1,429 | None for setting; confirmation only |
Appointment pricing looks expensive per unit and cheap per sale here, but remember it is not a like-for-like comparison: the vendor has done the setting work you would otherwise pay setters for. Add your setter labor to the lead examples before you compare.
Worked example 4: how does a live transfer compare?
A live transfer puts a screened homeowner on the phone with your team, so the contact stage is already done when you pay. Cost per sale depends on price per billable call and your appointment, sit and close rates. In the illustrative example below, a $150 transfer produces a lead cost per sale of about $1,786.
Illustrative example. Hypothetical inputs, not benchmarks. Published ranges for inbound calls and live transfers run $100 to $300+ per call according to The Leads Warehouse, as cited by ActiveProspect (July 2026).
| Input | Value | Running result |
|---|---|---|
| Price per billable transfer | $150 | 40 transfers cost $6,000 |
| Appointment rate (of transfers) | 40% | 16 appointments |
| Sit rate | 70% | 11.2 sits |
| Close rate | 30% | 3.36 sales |
| Lead cost per sale | $6,000 ÷ 3.36 = $1,786 | |
What to check before trusting this math
- Billable duration. Transfers are usually billed once a call passes a set number of seconds. A short billable threshold means you pay for calls that end before any real conversation. Ask for the threshold in writing.
- Who answers. A transfer is only worth its price if a trained person picks up every time. Missed transfers are paid for and wasted. Staff the line or route overflow to a second rep.
- Screening questions. The appointment rate depends on what the screener asked. Homeownership, bill size and timeline screening raises the price and the appointment rate together.
- Your setter savings. A transfer replaces the contact stage, which is the most labor-intensive part of working web leads. Credit that saving when you compare transfers with exclusive leads.
Availability of live transfers for your territory is confirmed on the call. The solar live transfer leads guide explains call buckets and billing terms in more depth.
Which funnel stage moves cost per sale the most?
Every funnel stage moves cost per sale by the same proportion, because the rates multiply. A 10% relative improvement in contact rate cuts cost per sale by about 9%, exactly like a 10% relative improvement in close rate. What differs is how cheap each improvement is to get. Contact rate is usually the cheapest to fix.
Sensitivity table
Illustrative example. Base case is the exclusive lead from example 2 ($160 per lead, 70% contact, 35% set, 70% sit, 30% close, lead cost per sale $3,110). Each row changes one input.
| Change | New lead cost per sale | Change vs base |
|---|---|---|
| Base case | $3,110 | 0 |
| Lead price −10% ($144) | $2,799 | −$311 |
| Contact rate 70% → 80% | $2,721 | −$389 |
| Contact rate 70% → 55% | $3,958 | +$848 |
| Appointment rate 35% → 40% | $2,721 | −$389 |
| Sit rate 70% → 80% | $2,721 | −$389 |
| Close rate 30% → 35% | $2,666 | −$444 |
| Close rate 30% → 25% | $3,732 | +$622 |
Two lessons. First, a 10-point gain at any stage beats a 10% price cut in this example. Second, losses hurt more than gains help: dropping contact from 70% to 55% adds $848 per sale, more than double what a 10% price cut saves. A team that lets leads sit for an hour can erase any discount it negotiated.
Speed to lead as a hidden lever
Contact rate is mostly a function of how fast and how persistently you call. SolarReviews reports an 80% to 85% contact rate on its own leads when called immediately, and UpLead cites a 75% to 80% contact rate for installers who call immediately and follow up regularly in the first few hours (both vendor-reported). The point is direction, not the exact figure: the first minutes matter most. Practical levers include:
- Real-time delivery straight into your dialer, not a daily email digest. Our leads offer real-time delivery to your CRM, dialer, email, or SMS.
- A rule that every new lead is called within five minutes during business hours.
- A multi-day cadence of calls and texts for leads you do not reach on the first attempt, within the limits of the consent you hold.
- Coverage outside office hours, when many homeowners fill in forms.
See solar speed to lead for a full cadence.
How do you calculate break-even against gross margin?
Break-even lead cost per sale equals the gross margin per job minus sales labor and the profit you require. If a job earns $9,000 gross margin, sales commission and setter time cost $3,000, and you want $2,500 of profit, you can spend up to $3,500 in leads per sale. Above that, the source loses money.
Break-even close rate
Rearranging the formula gives the minimum close rate a source must hit:
Break-even close rate = price per lead ÷ (max lead cost per sale × contact × appointment × sit)
Illustrative example: a $160 lead, $3,500 maximum lead cost per sale, 70% contact, 35% set, 70% sit. Break-even close rate = 160 ÷ (3,500 × 0.7 × 0.35 × 0.7) = 160 ÷ 600.25 = 26.7%. If your closers close fewer than about 27% of sits, this source loses money at these rates.
Margin by financing type
Gross margin differs by how the homeowner pays, and the mix changed in 2026.
| Financing type | Who owns the system | Typical margin pattern for the installer | What to watch |
|---|---|---|---|
| Cash | Homeowner | Full contract margin, paid on milestones | Fewer buyers after 25D ended |
| Loan | Homeowner | Contract margin minus dealer fees on some loan products | Dealer fees can be large; financing approval affects close rate |
| Lease / PPA (TPO) | Third-party owner | Fixed payment per watt from the financier, often lower and more predictable | Financier program rules and pricing changes |
Use your own contracts to set margin per job by financing type. If your mix shifts toward TPO, your break-even lead cost per sale may shift too.
Post-25D margin pressure
The residential clean energy credit (Section 25D) ended for systems placed in service after December 31, 2025, according to the IRS. Cash and loan buyers lost a 30% credit, so installers face a choice: hold price and accept lower close rates, or cut price and accept lower margin. Either way, break-even lead cost per sale moves down. Business credits that support third-party ownership have their own rules and deadlines; talk to your tax advisor about specific projects. Our guide to the post-25D solar market covers what this means for demand.
Re-run your break-even numbers quarterly. A lead source that cleared your threshold in 2025 may not clear it now, even at the same price and the same close rate on paper.
How do referrals and lifetime value change lead ROI?
Referrals and add-on sales raise the value of each customer above the first contract, which raises the lead cost per sale you can afford. SolarReviews uses this logic in its lead valuation guidance. Count only value you actually track: referral sales tied to a source customer, battery or panel add-ons, and service plans.
What to count
- Referral sales. If one in ten customers refers a neighbor who buys, each customer is worth the first job plus a tenth of a second job's margin. Track the referring customer in your CRM, or you cannot claim the value.
- Add-ons. Battery retrofits, panel expansions, EV chargers and main panel upgrades sold later to the same customer.
- Service and monitoring plans if you sell them.
Illustrative example: gross margin on the first job is $9,000. Your tracked data show 8% of customers produce a referral sale (margin $9,000) and 10% buy a later add-on (margin $1,500). Expected lifetime margin per customer = 9,000 + 0.08 × 9,000 + 0.10 × 1,500 = $9,870. Your break-even rises by $870 per sale.
Tracking requirements
Lifetime value math only holds if the CRM records:
- Original lead source on every customer record
- "Referred by" field on every new lead
- Add-on sales linked to the original customer, not created as new customers
- Cancellation status updated when it happens
Without those fields, leave lifetime value out and judge sources on the first job alone. It is safer to under-count than to justify a losing source with value you cannot see.
How does lead ROI change with installer size?
Lead ROI depends on team capacity as much as on lead price. Small teams without setters usually get the best return from appointments or exclusive leads, because they cannot win speed races. Mid-size teams can mix exclusive leads with appointments. Large teams with dialers and full-time setters can make shared and aged leads work because they can call at volume within minutes.
Illustrative scenarios. All inputs are hypothetical and reuse the example rates above. They show how to size a plan, not what any company achieved.
| Scenario | Team | Lead type | Monthly sales target | Units needed | Lead spend | Lead cost per sale |
|---|---|---|---|---|---|---|
| Small installer | Owner plus one closer, no setter | Booked appointments, $300 | 4 | 19 appointments | $5,700 | $1,425 |
| Mid-size installer | Three closers, two setters | Exclusive leads, $160 | 15 | 292 leads | $46,720 | $3,115 |
| Large sales floor | Ten setters with a dialer | Shared leads, $45, called within a minute (65% contact) | 60 | 3,297 leads | $148,365 | $2,473 |
Reading the scenarios
- Small installer. Four sales a month from 19 appointments is about five appointments a week, which one closer and an owner can run. The same owner working about 78 exclusive leads a month (4 sales at the example 2 rates) would spend hours dialing instead of selling. The appointment plan buys back time.
- Mid-size installer. 292 exclusive leads a month is about 14 per working day, which two setters can call within minutes if delivery is real time. If volume spikes above what setters can reach quickly, contact rate drops and the modeled cost per sale breaks.
- Large sales floor. The shared-lead plan only works because contact rate stays at 65%. At the slower 45% rate in example 1, the same 60 sales would cost about $214,000 in leads. Speed is the whole business model for shared leads.
Capacity check before you buy
- Count closer hours available per week for consultations.
- Divide by hours per consultation, including travel. That is your weekly sit ceiling.
- Work backward through sit and set rates to the leads or appointments needed.
- Confirm setters can call that many new leads within five minutes during business hours.
- Buy only what the team can work. Extra volume is wasted budget.
Are solar leads worth it?
Solar leads are worth buying when your lead cost per sale, plus sales labor, stays below the share of gross margin you can afford for acquisition, and when your team has capacity to work them fast. They are not worth it when you cannot respond quickly, cannot track results by source, or sell in a market where your margin is thin.

When yes
- You have closers with open calendar time and crews with install capacity.
- You can call new leads within minutes during business hours.
- Your referral and organic pipeline is real but cannot grow fast enough on its own.
- You track every lead by source through to cancellation-adjusted sale.
- You can start small. Our terms: no long-term contracts. Start with a test batch, scale when the numbers work.
When no
- Your team is already at capacity. Extra leads will be called late and wasted.
- You do not track by source, so you will never know if a vendor works.
- Your margin per job leaves less room for acquisition than any lead type can meet.
- You expect a lead source to fix a closing problem. Leads do not improve a close rate.
Supplement, not substitute
Bought leads work best as one source among several: referrals, your own website and ads, partnerships and community presence. Diversified sources protect you if one vendor's quality drops or prices rise. Use purchased leads to fill specific gaps, such as a new territory, a slow season, or a new closer who needs appointments, and measure each source separately.
What benchmarks exist, and why not borrow them?
Published solar funnel benchmarks come almost entirely from lead vendors, use different definitions of each stage, and rarely state sample sizes or dates. Use them to spot unrealistic promises, not to set budgets. Your own 90-day baseline, tracked with fixed definitions, is the only benchmark that predicts your results.
Reported ranges
| Metric | Reported value | Source and date |
|---|---|---|
| Contact rate, called immediately | 80% to 85% | SolarReviews, own leads, via UpLead (updated Oct 2, 2026) |
| Lead to appointment | 20% to 30% | SolarReviews via UpLead (Oct 2026) |
| Lead to close | 3% to 7% | SolarReviews via UpLead (Oct 2026) |
| Lead to close, example | 6% (1 in 16 leads) | SolarReviews ROI example (undated) |
| Close rate, exclusive qualified | 8% to 15% | LeadGen Economy (updated Apr 21, 2026) |
| Close rate, shared (2 to 3 buyers) | 3% to 5% | LeadGen Economy (Apr 2026) |
| Close rate, set appointments | 15% to 25% | LeadGen Economy (Apr 2026) |
| Close rate, aged leads | 1% to 3% | LeadGen Economy (Apr 2026) |
| Customer acquisition cost per closed sale | $1,500 to $3,000 | LeadGen Economy (Apr 2026) |
Why we do not borrow them
- "Close rate" in these sources is mostly lead-to-sale, not sit-to-sale. Plugging an 8% figure into the close stage of the formula above would wildly overstate your cost per sale.
- None state sample sizes, time periods or how cancellations are treated.
- Every source sells leads or services to lead buyers.
- Your sales process, pricing, financing options and territory differ from the average.
How to build your own baseline
- Fix the four stage definitions in your CRM.
- Buy a test batch from one source, sized to produce 15 to 25 appointments.
- Track every lead for 90 days, including cancellations.
- Calculate each rate and the resulting cost per sale.
- Repeat for each source and lead type before comparing.
What mistakes distort solar lead ROI?
The most common solar lead ROI mistakes are judging a source too early, counting cancelled contracts as sales, leaving labor out, comparing different units (a lead against an appointment), and averaging several sources together. Each one makes a losing source look profitable or a good source look bad.
Six errors to avoid
- Judging in week one. Appointments set this week sit next week and close next month. Judge early on cost per appointment held, and on cost per sale only after 60 to 90 days.
- Counting signed instead of installed. Cancellations and financing declines can remove a meaningful share of signed deals. Use the cancellation-adjusted close definition above.
- Ignoring credits. Approved returns lower your net cost per lead. Track credits by source, and track how often a vendor refuses valid claims.
- Mixing units. A $300 appointment and a $160 lead are different products. Compare them on cost per sale after adding the setter labor the lead requires.
- Blended reporting. One combined "purchased leads" line hides the vendor that is losing money behind the one that is winning.
- Assuming rates are fixed. Rates change with volume. A vendor that performs well at 50 leads a month may not at 300, and your team's speed may fall as volume rises.
A quick audit for an existing source
Pull the last 90 days for one vendor. Count leads, credits, contacts, appointments set, appointments held and non-cancelled sales. Divide total spend by sales. If that number is above your break-even, cut volume and test a different lead type or market before renewing.
How should you set up CRM tracking for lead ROI?
Track lead ROI by giving every lead a source, cost, and timestamp at creation, then recording each funnel stage as a dated status change. A weekly scorecard by source and lead type shows contact, appointment, sit and close rates, plus cost per appointment and cost per sale, so you can act before a bad source burns a month of budget.
Fields to create
| Field | Type | Why it matters |
|---|---|---|
| Lead source (vendor) | Picklist | Separates vendors and in-house channels |
| Lead type | Picklist (exclusive, shared, aged, transfer, appointment) | Compares products fairly |
| Lead cost | Currency | Enables cost per stage |
| Received timestamp | Date-time | Speed-to-lead measurement |
| First call attempt timestamp | Date-time | Response time by rep |
| Contacted (date) | Date | Contact rate |
| Appointment set (date) | Date | Set rate |
| Appointment held (date) | Date | Sit rate |
| Contract signed (date) | Date | Close rate |
| Cancelled (date and reason) | Date + picklist | Cancellation-adjusted close rate |
| Contract value and gross margin | Currency | ROI per source |
| Return requested / credited | Checkbox + date | Net lead cost |
| Consent record ID | Text | Compliance audit trail; confirm requirements with counsel |
Weekly scorecard
Review one row per source and lead type every week:
- Leads received, credited returns, net leads
- Median minutes to first call attempt
- Contact rate, appointment rate, sit rate
- Cost per appointment set and cost per appointment held
- Sales and cost per sale (lagging; review monthly)
Set action thresholds in advance. For example, if cost per held appointment exceeds your target for two straight weeks, cut volume from that source by half and investigate. Pre-agreed rules stop the team from rationalizing a bad source.
What does a sale really cost once you add labor and credits?
Full acquisition cost per sale is lead cost per sale plus setter time, closer pay, software and travel, minus the value of approved replacement credits. Lead price is often less than half the real figure. Two sources with the same lead cost per sale can differ by hundreds of dollars once you count the hours each one takes to work.
The formula at the top of this guide isolates lead spend because it is the number vendors quote and the number you can compare across sources. It is not what a sale costs you. Before you decide whether a source is worth keeping, build the full stack.

The acquisition cost stack
| Component | How to calculate per sale | Where the data lives |
|---|---|---|
| Lead cost per sale | Net lead spend ÷ non-cancelled sales | Vendor invoices minus credits; CRM sales |
| Setter labor | Setter hours spent on the source × loaded hourly cost ÷ sales | Dialer talk and wrap time, payroll |
| Closer pay | Commission per sale, plus any base or per-sit pay ÷ sales | Commission plan, payroll |
| Software | Dialer, CRM, SMS and e-sign seats used for the source ÷ sales | Software invoices |
| Travel and design | Mileage, site survey and proposal design time per sit × sits ÷ sales | Mileage logs, design team time |
| Cancellation cost | Work done on deals that later cancel, spread over surviving sales | CRM cancellations |
"Loaded" hourly cost means wages plus payroll taxes, benefits and any per-seat overhead. If you pay a setter $20 an hour, the loaded cost is higher. Use your payroll provider's figure, not the wage.
Worked example: setter labor by lead type
Illustrative example. Hypothetical inputs chosen to show the method. Setter minutes per lead include every dial, voicemail, text and note across the full follow-up cadence, not just the first call. Loaded setter cost is set at $25 per hour.
| Lead type (rates from examples 1 to 4) | Units per sale | Setter minutes per unit | Setter hours per sale | Setter labor per sale |
|---|---|---|---|---|
| Shared lead | 79.4 | 20 | 26.5 | $662 |
| Exclusive lead | 19.4 | 25 | 8.1 | $202 |
| Live transfer | 11.9 | 15 | 3.0 | $74 |
| Booked appointment | 4.8 | 10 (confirmation only) | 0.8 | $20 |
Add those to the lead cost per sale from the examples and the order changes again. The shared lead goes from $3,571 to $4,233. The exclusive lead goes from $3,110 to $3,312. The appointment barely moves. This is the reason a cheap, labor-heavy source can look fine on an invoice report and lose money on a P&L.
Two notes on the method. First, measure setter minutes from your dialer, not from memory. Most teams underestimate how long they spend chasing leads that never answer. Second, if your setters are salaried and idle part of the day, their marginal cost for one more lead is close to zero until they are full. Once they are full, the next lead costs a new hire. Model the step, not the average.
Worked example: closer pay and travel
Illustrative example. Hypothetical inputs.
Assume closers earn a flat $2,000 commission per non-cancelled sale and nothing per sit. Travel and proposal design run $60 per sit (mileage plus about an hour of design time). At the exclusive lead rates, a sale takes 1 ÷ 0.30 = 3.33 sits.
- Commission per sale: $2,000
- Travel and design per sale: 3.33 × $60 = $200
- Software: dialer and CRM seats of $400 a month across a team that closes 20 sales a month from all sources = $20 per sale
Full acquisition cost per sale for the exclusive lead = $3,110 lead + $202 setter + $2,000 commission + $200 travel and design + $20 software = $5,532.
If your closers are paid per sit or carry a base salary, the closer line changes with sit and close rates too. A per-sit payment multiplies by sits per sale, which rises sharply when close rates fall. Put the closer plan into the model the way it actually pays.
How replacement credits change the math
Replacement credits lower your net cost per usable lead, but only for the reasons a vendor actually covers. Our terms cover disconnected numbers, wrong contact details, or leads outside your filters, within 7 days. Not covered: a prospect who isn't interested, doesn't answer, doesn't get financing approved, or doesn't buy. Every vendor draws this line somewhere, and the line matters more than the headline price.
Illustrative example. Hypothetical inputs.
- You buy 100 exclusive leads at $160 = $16,000.
- Eight have a disconnected number or wrong details. You report all eight inside the window; six are approved and replaced. Two were reported late.
- Usable leads = 100 − 8 + 6 = 98.
- Net cost per usable lead = $16,000 ÷ 98 = $163.27.
Without the claims process, usable leads would be 92 and the net cost per usable lead would be $173.91. The six approved replacements are worth about $10.64 per usable lead, or roughly $200 per sale at the example 2 rates. The two late claims cost real money. Put "report bad leads daily" on a setter's checklist and track approval rate by vendor.
What not to put in the stack
- Install costs. Equipment, crew labor, permits and interconnection belong in gross margin per job, not in acquisition cost. Mixing them double counts.
- General overhead. Rent, the owner's salary and accounting are real costs but do not change with one more lead source. Leave them out of source-level ROI and cover them in the profit you require per job.
- Brand marketing. Yard signs and sponsorships help every source a little. Do not allocate them to a single vendor.
Where does your funnel leak, and how do you find it?
A leaking funnel shows up as one stage rate falling below your own baseline while the others hold. Find it by comparing each stage rate for the source against your 90-day average for the same lead type, then checking the specific causes listed for that stage. Fix the cheapest leak first; contact rate leaks are usually cheapest.
Because the four rates multiply, a leak at any stage costs the same proportion of your sales. What differs is the cause, and causes at each stage have recognizable symptoms.
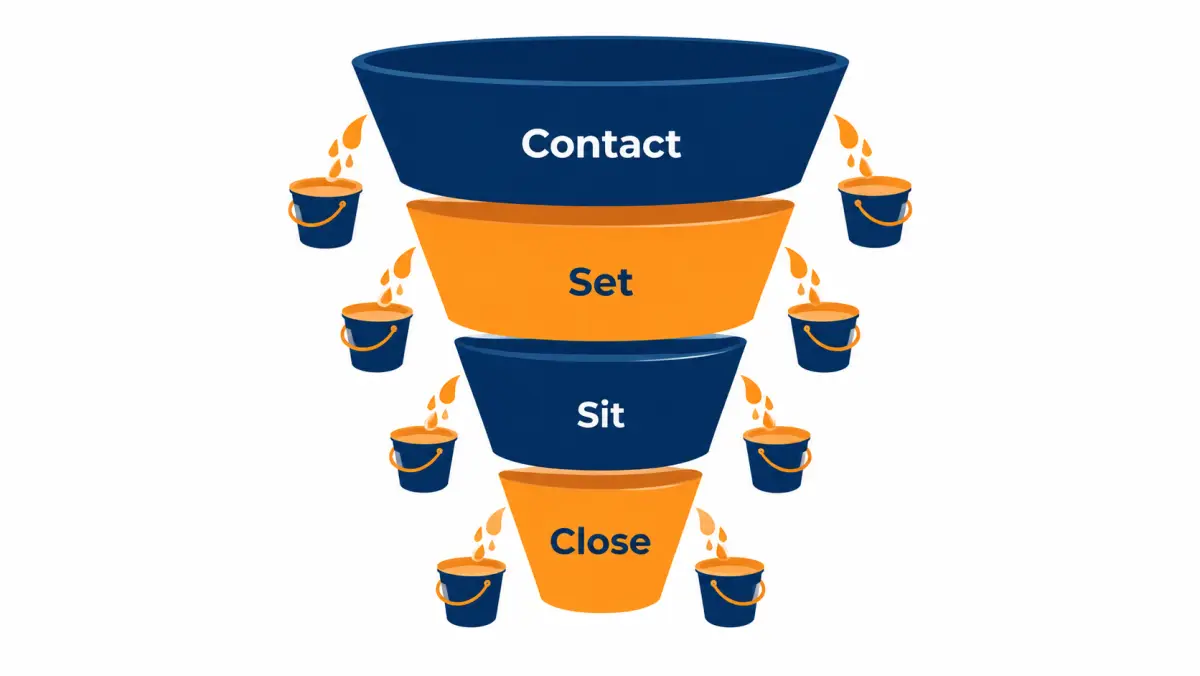
Stage-by-stage diagnosis
| Stage | Symptom | Likely causes to check | Typical fix |
|---|---|---|---|
| Contact | Contact rate falls; many leads end in "no answer" | Slow first call; leads arriving after hours; too few attempts; caller ID flagged as spam; bad numbers | Five-minute response rule; after-hours coverage; longer cadence within consent; register and monitor caller IDs; claim credits for bad numbers |
| Contact | Contacted people say they never asked to be called | Lead form unclear or not the source claimed; consent problems | Ask the vendor for the consent record and form page; pause the source until resolved; confirm with counsel |
| Appointment set | People talk but will not book | Lead intent is low; setter script asks too early; renters or low bills slipping through filters | Check filters against what you see; tighten the qualification questions; coach setters on offering two specific times |
| Sit | Booked appointments no-show | Long gap between booking and meeting; no confirmation; one decision maker missing | Book within 48 to 72 hours; confirm the day before and the day of; ask who else will be there when booking |
| Close | Sits happen but deals do not sign | Price gap after 25D; financing declines; closer skill; homeowner comparing several quotes | Review lost-deal reasons; check financing approval rates; compare closer-level close rates; check if the lead was shared |
| Close (net) | Deals sign then cancel | Buyer's remorse; financing changes; site issues found after signing; pressure at the table | Pre-qualify roof and shade before the sit; confirm financing earlier; review cancellation reasons by closer |
How to compare stage rates fairly
A stage rate only means something against the right baseline. Use these rules:
- Compare like with like. Exclusive leads against your exclusive baseline, appointments against your appointment baseline. Shared and exclusive leads are different products.
- Compare the same window. Appointments set this week have not had time to sit. Measure sit rate only on appointments whose scheduled date has passed.
- Use enough volume. A sit rate from eight appointments is noise. Wait for at least 20 before treating a change as real, and more for close rate.
- Watch for mix shifts. If one vendor sends more leads from a ZIP code where you close poorly, the vendor rate will fall even if lead quality is the same. Break rates out by territory when you can.
Worked example: finding the leak
Illustrative example. Hypothetical inputs.
A mid-size installer's 90-day baseline on exclusive leads is 70% contact, 35% set, 70% sit and 30% close. Last month, one source produced:
| Stage | Baseline | Last month | Gap |
|---|---|---|---|
| Contact | 70% | 58% | −12 points |
| Appointment set | 35% | 34% | −1 point |
| Sit | 70% | 69% | −1 point |
| Close | 30% | 29% (early read) | −1 point |
Set, sit and close are within noise. Contact dropped 12 points. That points away from lead quality (low-intent leads usually show up as a set-rate problem) and toward handling. The installer pulls median minutes to first call by day and finds it rose from 4 minutes to 41 minutes after a setter left and was not replaced. At baseline rates, the source's lead cost per sale was $3,110. At 58% contact, it was $3,110 × 70 ÷ 58 = $3,753. The fix is a hire or a routing change, not a new vendor.
Running the comparison this way stops the most common mistake in lead buying: blaming the vendor for a problem inside your own team, or the reverse.
Leaks that look like lead quality but are not
- Spam-labelled caller ID. If carriers label your outbound numbers as likely spam, contact rate falls for every source at once. Check whether the drop is across all sources.
- Calendar gaps. If closers have no slots for a week, setters book far out, and sit rate falls. Check booking-to-meeting lag.
- New closer. A new closer's lower close rate shows up on whichever source feeds them. Check close rate by closer before by source.
- Seasonal intent. Late-year holidays and summer vacations change contact and sit rates for all sources. Compare against the same season if you have it.
Leaks that really are lead quality
- Set rate falls while contact holds. People answer but have no real interest, often because the form promised something else.
- High share of filter failures. Renters, out-of-territory addresses or roof types you do not install. Those are usually credit-eligible if they fall outside your filters, so claim them.
- Duplicate leads. The same homeowner arriving from two sources, or twice from one. Our quality checks include duplicate-checking against leads already sent to you; check your CRM for duplicates across vendors, too.
- Homeowners who name three other installers. If many contacts say several companies have called, the lead may not be as exclusive as sold. Ask the vendor how exclusivity is enforced.
How big should a test batch be to judge ROI?
Size a test batch backward from held appointments, not from a lead count or a budget. Aim for 20 to 25 held appointments from the source, because close rate on fewer sits is mostly luck. Divide your target sits by contact × set × sit rate to get the number of leads to buy, then check your team can work them quickly.
Most installers size a test by budget ("let's try $5,000") or by a round number ("send me 50 leads"). Both leave you with too few sits to read a close rate. A test that cannot produce a decision is a cost with no information.
Worked example: sizing a test for each lead type
Illustrative example. Uses the hypothetical rates from examples 1 to 4. Target: 20 held appointments.
| Lead type | Held appointments per unit | Units to buy | Unit price (illustrative) | Test budget |
|---|---|---|---|---|
| Shared lead | 0.45 × 0.25 × 0.56 = 0.063 | 318 | $45 | $14,310 |
| Exclusive lead | 0.70 × 0.35 × 0.70 = 0.1715 | 117 | $160 | $18,720 |
| Live transfer | 0.40 × 0.70 = 0.28 | 72 | $150 | $10,800 |
| Booked appointment | 0.70 | 29 | $300 | $8,700 |
Before you buy, run the rates you actually expect, not the ones in this table. If you do not have a baseline, use a cautious guess and size up. A test that comes in under 20 sits should be extended, not judged.
Why 20 sits and not 5
Close rate is a yes-or-no result per sit, so small samples swing widely. With 20 sits and a true close rate of 30%, you would expect 6 sales, but the result can easily land anywhere from about 2 to 10 by chance alone (the standard deviation of a 20-trial count at 30% is about 2 sales). That is the difference between "this source is a disaster" and "this source is excellent," from the same underlying quality.
Three practical rules follow:
- Read the early stages first. Contact and set rates are measured on many more events than close rate, so they settle sooner. A test that shows 40% contact on exclusive leads after 60 leads is telling you something real.
- Judge close rate last and loosely. Treat a close rate from 20 sits as a range, not a point. Only call a source bad on close rate if it is far below your baseline.
- Pool similar tests. If you run two small tests from the same vendor and lead type in back-to-back months with the same team, combine them for the close rate read.
Pace the batch to your team
A test batch delivered all at once can break your contact rate. If 117 exclusive leads land in one week and two setters can only call 15 new leads a day within five minutes, a third of the batch waits. The test then measures your overflow, not the source.
Ask the vendor to pace delivery to a daily cap. Then hold your own response times steady through the test. If median minutes to first call drifts, the test result is contaminated.
Test batch checklist
- Write down the four stage definitions and the cancellation rule before the first lead arrives.
- Set the target held appointments (20 to 25) and calculate units to buy at cautious rates.
- Set a daily delivery cap your setters can call within five minutes.
- Confirm filters (ZIP codes, homeowner status, bill size, roof type) in writing.
- Confirm the replacement window and how to file claims. Our window is 7 days, filed by replying to the lead notification or emailing us.
- Create the vendor and lead-type values in the CRM so every lead is tagged on arrival.
- Agree go and no-go thresholds in advance (see the next section).
- Put review dates on the calendar: day 7, day 21, day 45, day 90.
What go and no-go rules should you set before testing?
Set go and no-go rules before the first lead arrives, tied to stage rates and cost per held appointment at fixed checkpoints. Early checkpoints catch handling and quality problems; the final checkpoint at 60 to 90 days judges cost per non-cancelled sale against break-even. Rules agreed in advance stop the team from rationalizing a source they like.
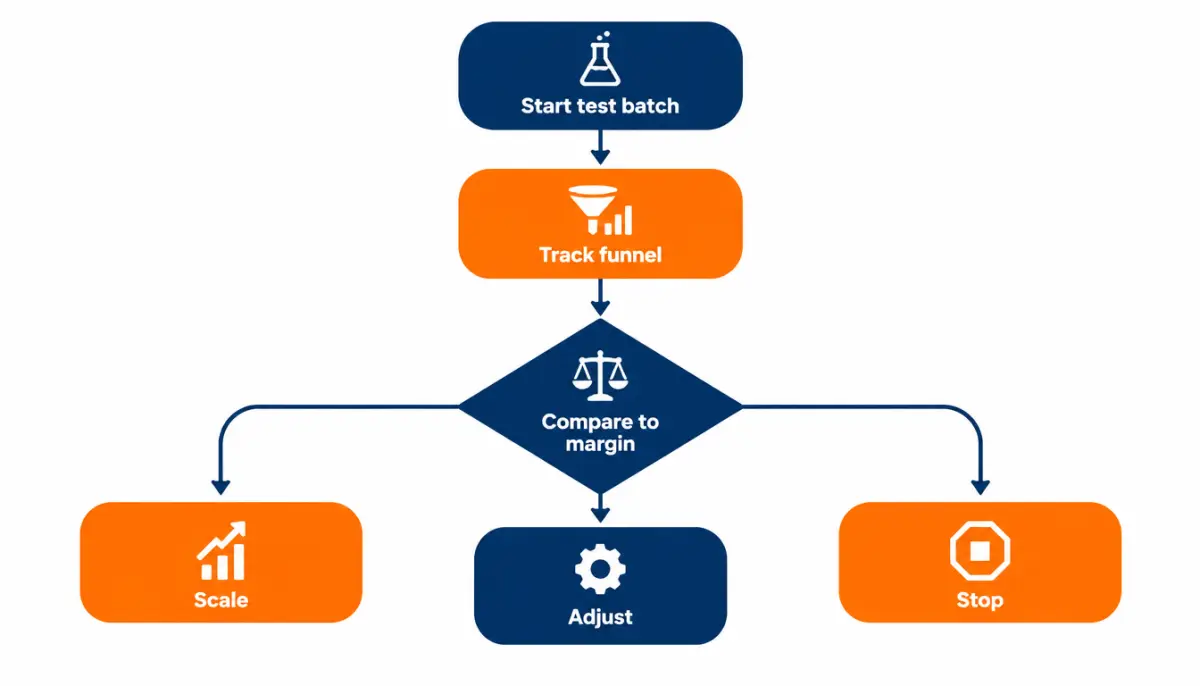
A checkpoint decision tree
Illustrative thresholds. Set yours from your own baseline and break-even.
| Checkpoint | What you can measure | Continue if | Investigate if | Stop if |
|---|---|---|---|---|
| Day 7 | Response time, contact rate, bad-data share | Contact within 10 points of baseline; bad data inside credit window | Contact 10 to 20 points under baseline | Contact 20+ points under baseline with fast response, or consent concerns |
| Day 21 | Set rate, early sit rate, cost per appointment set | Cost per appointment set within 20% of target | Within 20% to 40% over target | More than 40% over target with handling confirmed normal |
| Day 45 | Sit rate, cost per held appointment, early closes | Cost per held appointment at or under target | Up to 30% over target | More than 30% over with no handling cause |
| Day 90 | Cancellation-adjusted sales, full acquisition cost per sale | Under break-even with margin to spare: scale in steps | Near break-even: hold volume, test filters | Over break-even: stop or change lead type |
How to set the cost per held appointment target
Cost per held appointment is the earliest number that carries most of the funnel. Derive it from break-even:
Target cost per held appointment = maximum lead cost per sale × your baseline close rate
Illustrative example: if your maximum lead cost per sale is $3,500 and your baseline close rate on held appointments is 30%, your target cost per held appointment is $1,050. A source running at $900 per held appointment by day 45 is on track. One running at $1,500 needs a close rate of $1,500 ÷ $3,500 = 43% to break even, which is unlikely if your baseline is 30%.
When a test result is "investigate"
"Investigate" is the most common outcome and the most useful one. Work through these in order before calling the vendor:
- Response time. Pull median and 90th-percentile minutes to first call. If either rose, fix handling first.
- Filter match. Sample 20 leads and check them against the filters you agreed. Claim the misses.
- Territory mix. Compare the source's ZIP codes with where you usually close well.
- Closer mix. Check which closers ran the sits. A new closer can drag a source.
- Then the vendor. Bring specific numbers: contact rate, filter-miss count, examples. Vague complaints get vague answers.
Scaling after a "go"
Scale in steps, not leaps. Rates measured at 120 leads a month do not automatically hold at 500. Contact rate is the first to slip as setters fill up, and some vendors source differently at higher volume.
- Raise volume by 25% to 50% per step.
- Hold each step for at least a month.
- Re-check contact rate and median response time at each step.
- Hire or add dialer capacity before the step, not after contact falls.
How long does a lead batch take to pay back?
A lead batch pays back when the gross margin collected from its sales exceeds what you spent acquiring them. Because leads are paid for upfront while install payments arrive weeks or months later, payback lags spend by roughly one to two sales cycles plus your install timeline. Plan working capital for that gap before you scale.
ROI and cash flow are different questions. A source can have strong ROI and still strain your bank account, because you pay for leads in month one and collect install payments in month three or four.
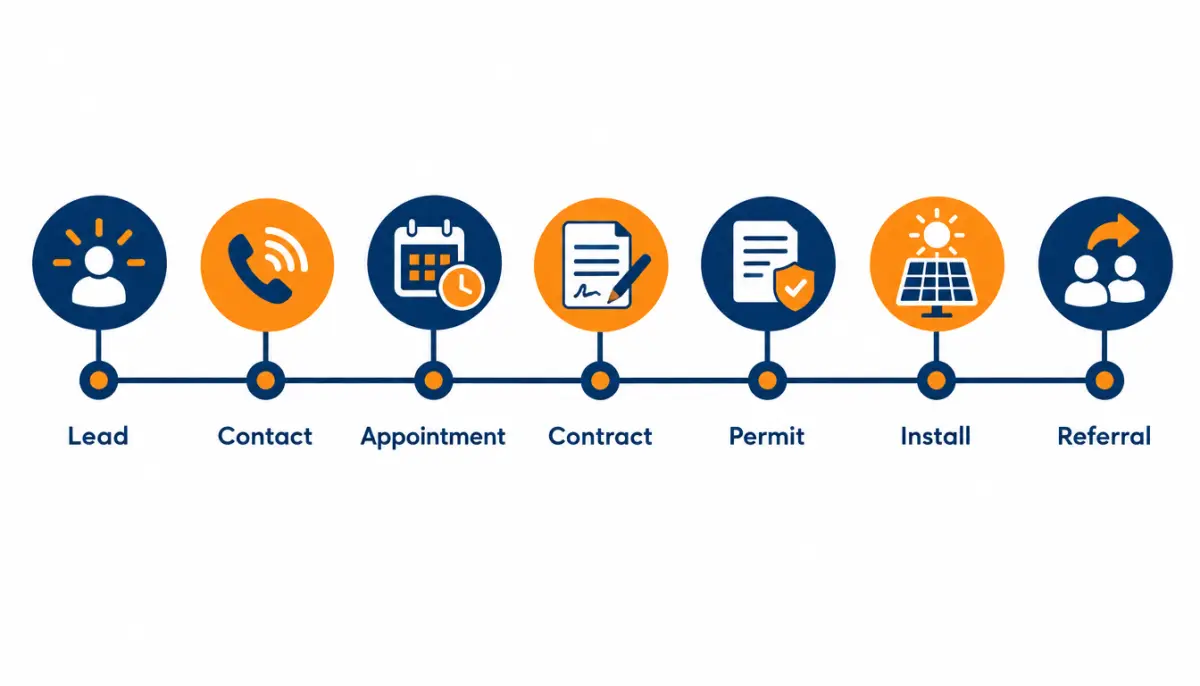
The timeline from lead to cash
Illustrative timeline. Durations vary widely by market, utility, permitting office, financing type and your own operations. Replace each step with your own medians.
| Step | Illustrative timing after lead arrives | Cash event |
|---|---|---|
| Lead delivered and paid for | Day 0 (or on invoice terms) | Cash out: lead cost |
| Contact and appointment set | Day 0 to 3 | Cash out: setter labor |
| Appointment held | Day 2 to 10 | Cash out: travel and design |
| Contract signed | Day 2 to 30 | Possible deposit, depending on financing |
| Cancellation and financing window passes | A few days to several weeks after signing | Sale counts for ROI |
| Site survey, design, permit, utility application | Weeks to months | Cash out: survey and permitting costs |
| Installation | After permit approval | Milestone payment on many contracts |
| Inspection and permission to operate | After install | Final milestone payment; commission often paid |
On the cancellation window: the FTC's Cooling-Off Rule generally gives buyers three business days to cancel certain sales made at their home, and many states add their own rules for home solicitation and solar contracts. How these apply to your contracts is a question for counsel. For ROI purposes, do not count a sale until whatever window applies has passed and financing is approved.
Worked example: cash flow for a steady monthly buy
Illustrative example. Hypothetical inputs.
An installer buys 100 exclusive leads a month at $160 ($16,000). At the example 2 rates that produces about 5.1 sales per month. Assume:
- Sales sign, on average, in the month after the leads arrive.
- Install and final payment arrive, on average, two months after signing.
- Gross margin per job is $9,000, collected at final payment for simplicity.
- Acquisition cost beyond leads (setter, commission, travel, software) is about $2,400 per sale, with commission paid at final payment.
| Month | Lead spend out | Sales signed | Jobs paid | Net cash for the month | Cumulative |
|---|---|---|---|---|---|
| 1 | −$16,000 | 0 | 0 | −$16,000 | −$16,000 |
| 2 | −$16,000 | 5.1 | 0 | −$16,000 | −$32,000 |
| 3 | −$16,000 | 5.1 | 0 | −$16,000 | −$48,000 |
| 4 | −$16,000 | 5.1 | 5.1 | +$17,660 | −$30,340 |
| 5 | −$16,000 | 5.1 | 5.1 | +$17,660 | −$12,680 |
| 6 | −$16,000 | 5.1 | 5.1 | +$17,660 | +$4,980 |
Monthly net cash once the pipeline is full: 5.1 jobs × ($9,000 − $2,400) − $16,000 = $33,660 − $16,000 = $17,660. The point is the trough: this plan needs about $48,000 of working capital before the first job pays, and it does not turn cumulative-positive until month six.
Treat that table as a template. If your permitting office is slow, or most of your buyers finance through a product that pays you later, the trough is deeper and longer.
Cash flow rules of thumb
- Fund three months of lead spend before scaling. In the example, three months of spend is the full trough.
- Scale slower than ROI says you can. Each step up in volume deepens the trough again.
- Watch milestone payment terms. Contracts that pay a meaningful share at signing or at install shorten the gap.
- Track lead spend as a pipeline investment. On the monthly P&L, a month with heavy lead spend and few installs looks bad even when the source works.
How do you track lead ROI by cohort?
Cohort tracking groups leads by the month they arrived and follows each group's sales over time, so you judge every batch on its full results instead of mixing old and new leads. Report cumulative sales per cohort at 30, 60 and 90 days. A source is working when each new cohort's curve tracks or beats earlier ones.
Monthly reports usually say "we spent $16,000 on leads this month and closed 6 deals." Those 6 deals came from leads bought last month and the month before. The ratio mixes time periods and hides whether the source is getting better or worse.
How to build a cohort table
- Tag every lead with its arrival month (from the received timestamp).
- For each cohort, count non-cancelled sales whose lead arrived that month, measured at 30, 60 and 90 days after the end of the month.
- Divide the cohort's net lead spend by sales at each checkpoint.
- Add a new row each month; never re-assign sales to the month they closed.
Worked example: reading cohorts
Illustrative example. Hypothetical numbers for one exclusive lead source at 100 leads and $16,000 per month.
| Cohort | Net spend | Sales by day 30 | Sales by day 60 | Sales by day 90 | Lead cost per sale at day 90 |
|---|---|---|---|---|---|
| Month A | $16,000 | 2 | 4 | 5 | $3,200 |
| Month B | $16,000 | 2 | 5 | 6 | $2,667 |
| Month C | $16,000 | 1 | 3 | 3 | $5,333 |
| Month D | $16,000 | 3 | — | — | Too early |
Month C stands out. Before blaming the vendor, check the month: did a closer leave, did response time slip, did delivery shift into a new ZIP range? If month D's day-30 count is back at or above A and B, month C was probably an internal or seasonal dip. If D also lags, raise it with the vendor with the stage-rate evidence.
Cohort tables also answer the question most owners ask too early: "Is this source working?" At day 30, Month D looks strong, but day-30 counts are a fraction of the final result. Compare cohorts at the same age, always.
Cohorts and cancellations
Cancellations arrive late. A sale counted at day 30 may cancel at day 45 if financing fails. Recount every cohort at each checkpoint from the current CRM status, so a cancelled deal drops out of the cohort where its lead arrived. That is the only way cancellation-adjusted close rate stays honest.
What is the most you can pay per lead and still break even?
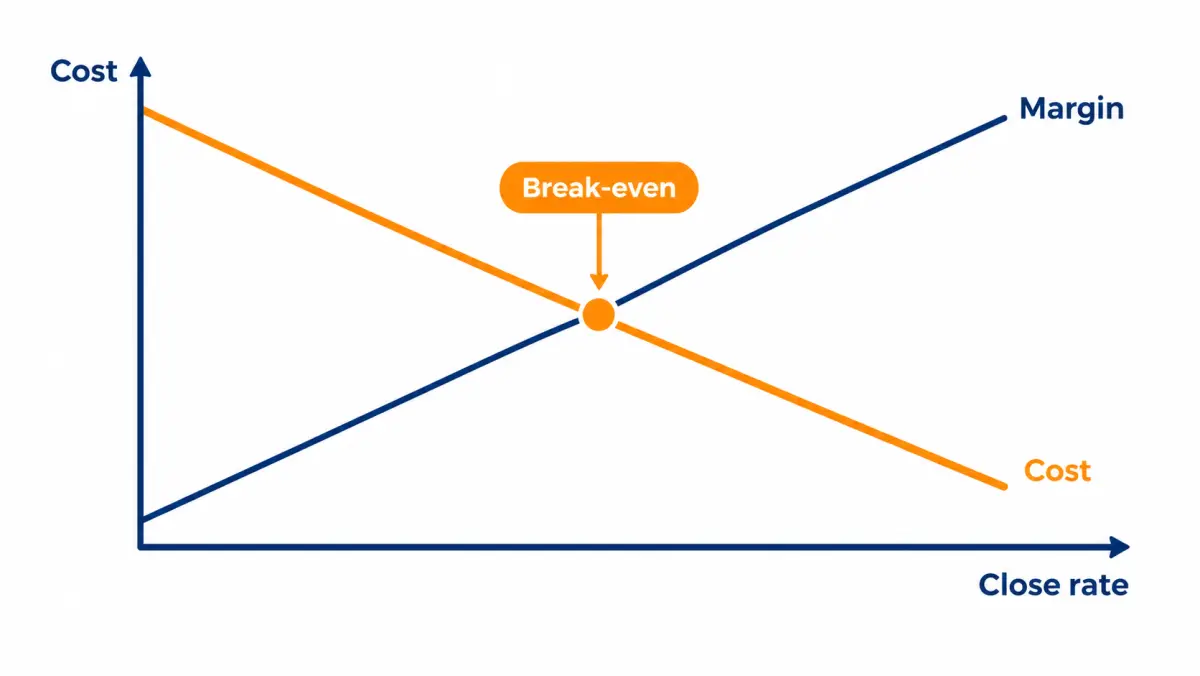
The maximum price you can pay per lead equals your maximum lead cost per sale multiplied by your lead-to-sale rate. Maximum lead cost per sale is gross margin per job minus non-lead acquisition costs and your required profit. Run that number for each lead type before negotiating, and walk away from any price above it.
Most installers negotiate price first and check the math later. Reverse the order. Work out your ceiling, then see whether any vendor's price fits under it with room for bad months.
The ceiling formulas
Maximum lead cost per sale = gross margin per job − non-lead acquisition cost per sale − required profit per job
Maximum price per lead = maximum lead cost per sale × (contact × set × sit × close)
Maximum price per booked appointment = maximum lead cost per sale × (sit × close)
Maximum price per live transfer = maximum lead cost per sale × (set × sit × close)
Worked example: ceiling prices by margin
Illustrative example. Hypothetical inputs. Non-lead acquisition cost (setter, commission, travel, software) is set at $2,500 per sale and required profit at $2,500 per job, so maximum lead cost per sale = gross margin − $5,000.
| Gross margin per job | Max lead cost per sale | At 2% lead-to-sale | At 3.5% lead-to-sale | At 5% lead-to-sale |
|---|---|---|---|---|
| $6,000 | $1,000 | $20 | $35 | $50 |
| $8,000 | $3,000 | $60 | $105 | $150 |
| $10,000 | $5,000 | $100 | $175 | $250 |
| $12,000 | $7,000 | $140 | $245 | $350 |
| Max lead cost per sale | Per booked appointment (70% sit × 30% close) | Per live transfer (40% set × 70% sit × 30% close) |
|---|---|---|
| $1,000 | $210 | $84 |
| $3,000 | $630 | $252 |
| $5,000 | $1,050 | $420 |
| $7,000 | $1,470 | $588 |
Note that the appointment and transfer ceilings assume you add no setter labor for those products, so the $2,500 of non-lead cost is mostly commission and travel. If an appointment product still needs confirmation calls from your staff, subtract that small cost first.
Three things the ceiling table shows
- Thin margin rules out most lead buying. At $6,000 gross margin and these cost assumptions, even a 5% lead-to-sale rate only supports a $50 lead. If your margin is in that zone, fix pricing or cost of goods before buying leads.
- Your conversion rate is worth more than any discount. Moving from 2% to 5% lead-to-sale raises the price you can afford by 2.5 times. That is why the same lead can be profitable for one installer and a loss for another.
- Profit target is a choice. Lower the required profit and the ceiling rises dollar for dollar. Set the target before testing and do not lower it to rescue a source you like.
Build a safety margin into the ceiling
Rates vary month to month. If you buy at exactly your break-even price, half your months will lose money. A simple approach: set your walk-away price at 75% to 85% of the ceiling, so a source still clears break-even when contact or close dips for a month.
Illustrative example: ceiling of $150 per lead, walk-away at 80% = $120. If a vendor quotes $135 for your ZIP codes, the source only works if your rates hold near your best months. That is a test-small decision, not a scale decision.
Break-even by financing mix
If your gross margin differs by financing type, your ceiling differs too. Compute a blended margin from your actual mix, and recompute when the mix moves.
Illustrative example: 30% of jobs are cash at $11,000 margin, 50% are loans at $9,000 after dealer fees, and 20% are third-party owned at $7,000. Blended margin = 0.3 × 11,000 + 0.5 × 9,000 + 0.2 × 7,000 = 3,300 + 4,500 + 1,400 = $9,200. If the mix shifts to 15% cash, 45% loan and 40% third-party owned, blended margin = 1,650 + 4,050 + 2,800 = $8,500. The ceiling drops by $700 per sale without any change in lead price or close rate.
This is one of the clearest ways the end of the 25D credit shows up in lead math. If fewer homeowners buy with cash or loans and more choose leases or PPAs, the blended margin moves, and so does your ceiling. See the post-25D solar market for the demand side of that shift.
How does lead type change ROI once labor is counted?
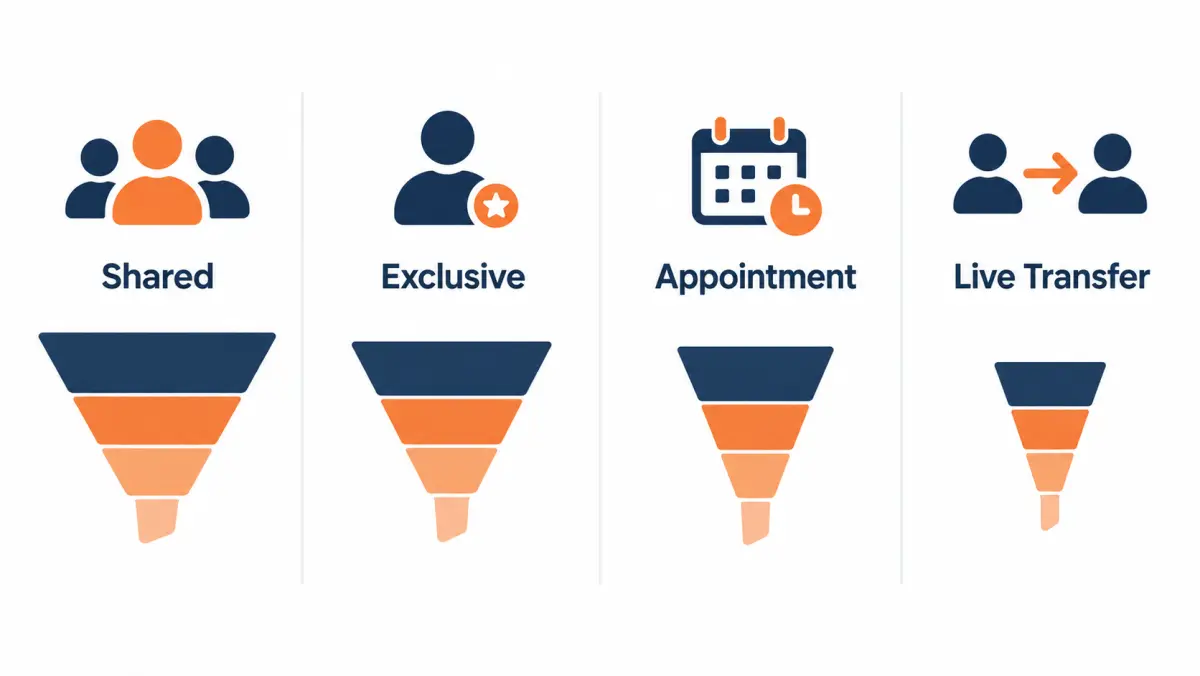
Once setter labor is added, lead types rank differently than they do on price. Products that arrive with the contact or setting work already done (live transfers and booked appointments) shed most of the labor cost, while cheap lead types such as shared and aged leads carry the heaviest labor per sale. Compare lead types on full acquisition cost, never on unit price.
Worked example: five lead types on one table
Illustrative example. Hypothetical inputs. The first four rows reuse examples 1 to 4. The aged lead row uses a hypothetical $8 price with 15% contact, 20% set, 50% sit and 25% close, and 8 setter minutes per lead. Loaded setter cost $25 per hour.
| Lead type | Unit price | Units per sale | Lead cost per sale | Setter labor per sale | Lead + setter per sale |
|---|---|---|---|---|---|
| Shared | $45 | 79.4 | $3,571 | $662 | $4,233 |
| Exclusive | $160 | 19.4 | $3,110 | $202 | $3,312 |
| Aged | $8 | 267 | $2,133 | $889 | $3,022 |
| Live transfer | $150 | 11.9 | $1,786 | $74 | $1,860 |
| Booked appointment | $300 | 4.8 | $1,429 | $20 | $1,449 |
Do not read this as a ranking of lead types. Every row depends on inputs that vary by vendor, market and team. Read it as a method: each product shifts cost between the vendor's invoice and your payroll, and you have to count both.
What each lead type is really buying
| Lead type | What the price buys | Work left for your team | Main ROI risk |
|---|---|---|---|
| Shared | Contact details and stated interest, also sold to other buyers | Win a speed race, then set, sit and close against competitors | Contact and close rates collapse if you are not first |
| Exclusive | Contact details and stated interest, sold to one company | Contact, set, sit and close | Slow response wastes the exclusivity you paid for |
| Aged | Older records at a low price | Large-volume dialing, re-qualification, set, sit and close | Labor per sale and consent age; confirm consent coverage with counsel before calling |
| Live transfer | A screened homeowner on the line | Answer every transfer, set, sit and close | Paying for missed transfers or very short billable calls |
| Booked appointment | A scheduled meeting with a qualified homeowner | Confirm, sit and close | No-shows and replacement terms |
For a deeper look at each product, see exclusive solar leads, aged solar leads, solar live transfer leads and solar appointments. Availability of aged leads and live transfers for your territory is confirmed on the call.
Aged leads: the labor trap and the consent question
Aged leads deserve their own warning because their price makes ROI look easy. In the illustrative row above, the aged lead is the third-cheapest per sale on lead cost alone, but it takes 267 dials-worth of records per sale, and its setter labor is the highest of the five. If setters are paid by the hour and would otherwise be idle, that labor is cheap. If you would have to hire for it, it is not.
Consent is the second issue. A record that was collected months ago may carry consent that does not name your company, or that a homeowner has since revoked. The FCC's one-to-one consent rule was vacated by the Eleventh Circuit on January 24, 2025, but other TCPA requirements and state rules still apply. Ask what consent record comes with each aged record and confirm with counsel before calling. The cost of a compliance problem can exceed every dollar of ROI the list produced. Our TCPA compliance guide for solar leads covers what buyers should verify.
Mixing lead types in one plan
Most installers do best with a mix, sized to team capacity:
- Appointments to keep closers' calendars full on slow weeks and to feed new closers.
- Exclusive leads as the core volume source, sized to what setters can call within minutes.
- Live transfers where a setter is available to take calls during set hours.
- Aged or shared leads only when there is idle setter capacity and a clear consent position.
Track each type as its own source in the CRM. A blended "leads" line hides which part of the mix is earning.
What does lead ROI look like for different installer businesses?
Lead ROI depends on who is working the leads, so the same source performs differently for an owner-operator, a roofer adding solar, a regional installer entering a new territory and a high-volume sales organization. The four illustrative walkthroughs below show how to set targets, choose lead types and run the first 90 days for each.
All four walkthroughs are illustrative. Companies, numbers and outcomes are hypothetical, built to show the planning method. They are not clients or results.

Walkthrough A: owner-operator with one crew
Situation. The owner sells and manages installs. One crew can install about six residential systems a month. Referrals produce two or three sales a month. Gross margin per job is $9,500 (illustrative). There is no setter.
Goal. Fill the crew: three extra sales a month.
Capacity check. The owner can run about eight consultations a week around site visits. That is not the constraint. The constraint is phone time: the owner cannot call new web leads within five minutes while on a roof.
Lead type choice. Booked appointments, with a small test of exclusive leads routed to a part-time virtual assistant during business hours.
Math. At a hypothetical $300 per appointment, 70% sit and 30% close, three sales need about 14.3 appointments, or $4,290 a month. Lead cost per sale ≈ $1,429. Add travel, design and the owner's own time. Against $9,500 margin, the source has room.
First 90 days.
- Month 1: buy 15 appointments, paced over four weeks. Confirm each the day before. Report no-shows inside the replacement window.
- Month 1: separately, buy a small exclusive batch, sized to the assistant's capacity, to learn the contact rate when someone else does the calling.
- Month 2: review cost per held appointment against the target (maximum lead cost per sale × close rate).
- Month 3: count cancellation-adjusted sales from month 1's cohort. Decide whether to scale appointments, add exclusive volume, or hold.
What to watch. Owner-operators often close well because the buyer meets the person who will stand behind the work. If the owner's close rate is far above 30%, the ceiling price per appointment rises with it.
Walkthrough B: roofing company adding solar
Situation. An established roofer has crews, a sales team that sells roofs, and a customer list. They have partnered with an installer or hired a solar crew lead. Gross margin per solar job is uncertain because they have done only a handful.
Goal. Learn whether solar can become a steady line.
Key risk. The sales team knows roofing, not solar financing, utility rate structures or post-25D economics. Close rate is unknown and probably low at first.
Lead type choice. Start with existing customers whose roofs the company replaced recently (in-house, no lead cost), then a small exclusive batch.
Math approach. Because close rate is unknown, run the break-even close rate formula from earlier to set the bar. If the max lead cost per sale is $3,000, the lead costs $160, and the team hits 70% contact, 35% set and 70% sit, the break-even close rate is 160 ÷ (3,000 × 0.1715) = 31%. A new solar sales team is unlikely to hit that in month one.
First 90 days.
- Train two salespeople on solar proposals and financing before buying anything.
- Work the in-house list first to build a close rate baseline at no lead cost.
- Buy one exclusive test batch sized to 20 held appointments only after the team has run at least ten in-house consultations.
- Compare the close rate on bought leads with the close rate on in-house customers. A large gap points to trust, not the lead.
What to watch. Roof condition is an advantage. Homeowners who need a new roof soon are a natural fit for a combined project. Track it as its own segment.
Walkthrough C: regional installer opening a new territory
Situation. A 40-person installer is expanding into a neighboring metro. No brand recognition there, no referrals yet. Strong close rate (35% of sits) in the home market. Gross margin per job $10,000.
Goal. Ten sales a month in the new territory within two quarters.
Key risk. Home-market rates will not transfer. Contact may hold, but close rate in a new market is often lower until reviews and installs accumulate.
Lead type choice. Exclusive leads filtered to the new ZIP codes, plus a modest appointment buy to keep the territory's first closer busy.
Math. Plan with a cautious close rate of 25% (not the home 35%). At 70% contact, 35% set and 70% sit, lead-to-sale = 0.1715 × 0.25 = 4.3%. Ten sales need about 233 leads a month. At a hypothetical $160, that is about $37,300 a month, or $3,730 per sale. With $10,000 margin and roughly $2,800 of non-lead acquisition cost, the source clears about $3,470 of profit per sale even at the cautious rate.
First 90 days.
- Start at 40% of the target volume. Hire the territory's setter before leads arrive.
- Separate the new territory in the CRM so its rates are never blended with the home market.
- At day 45, compare new-territory stage rates with the home market. Expect lower close; watch for lower sit (unfamiliar brand) too.
- Step volume up only after the first cohort reaches day 60.
What to watch. Each install in the new territory is also a future referral source and a local review. Track referral sales back to source customers so that value is counted later, as described in the lifetime value section.
Walkthrough D: high-volume sales organization
Situation. A sales organization sells for several install partners. Twelve setters, a predictive dialer, twenty closers. Paid on volume.
Goal. Lower full acquisition cost per sale while holding volume.
Key risk. At volume, small rate changes cost large sums. A 5-point contact drop across 3,000 leads a month removes many appointments.
Lead type choice. A mix: exclusive as the core, shared where the dialer reliably wins the speed race, live transfers during staffed hours, and aged lists only with a documented consent position reviewed by counsel.
Math approach. Run the full stack per lead type, monthly, with real dialer minutes. Rank sources by full acquisition cost per sale and shift budget toward the cheapest at the margin, one step at a time.
First 90 days of a new source.
- Route the new source to the top-performing setter pod, so the test measures the source and not training gaps.
- Hold the new source at a fixed daily cap and compare against the incumbent sources on the same days.
- At day 21, compare cost per appointment set; at day 45, cost per held appointment; at day 90, full acquisition cost per sale.
- Replace, do not add: if the new source wins, take budget from the weakest incumbent.
What to watch. At this scale, closer-level variation is large. Route leads by closer performance carefully, and measure source ROI on a closer-neutral basis (see the closer section below).
How do you measure ROI on commercial solar leads?
Commercial solar lead ROI uses the same logic as residential but different stages and a longer clock. Replace contact, set, sit and close with contact, discovery meeting, site assessment, proposal and signed contract, and measure against gross margin per project. Because cycles run many months and project sizes vary widely, judge commercial sources on pipeline value created per dollar before closed revenue arrives.

Commercial funnel stages
| Stage | Counts as success | Common blockers |
|---|---|---|
| Contact | Conversation with someone at the business who can describe the site and bills | Gatekeepers, wrong department, multi-site companies |
| Discovery meeting | Meeting held with the owner, facilities lead or finance lead | Lead submitted by someone with no authority |
| Site assessment | Roof, electrical and interval data reviewed | Roof age, structural limits, lease terms on the building |
| Proposal | Formal proposal with financial model presented to decision makers | Capital budget timing, board approval cycles |
| Signed contract | Contract executed and financing in place | Financing, interconnection study results, landlord consent |
Worked example: commercial pipeline ROI
Illustrative example. Hypothetical inputs only.
An installer buys 30 commercial leads at a hypothetical $400 each ($12,000). Over the following months:
- 60% are contacted: 18
- 40% of contacts agree to a discovery meeting: 7.2
- 60% of meetings proceed to a site assessment: 4.3
- 70% of assessments get a proposal: 3.0
- 25% of proposals sign: 0.76
Lead cost per signed project = $12,000 ÷ 0.76 = about $15,900. That looks alarming next to a residential figure, but commercial projects are larger. If an average signed project earns $60,000 gross margin (illustrative), lead cost is about a quarter of margin before sales labor. If the average project earns $25,000, it is closer to two-thirds, and the source probably fails once engineering and sales time are added.
Use pipeline value as the early read
Signed commercial projects can take two or three quarters. Waiting that long to judge a source wastes a budget cycle. Use pipeline value as the interim signal:
Pipeline value per lead dollar = (sum of proposal values × your historical proposal-to-signed rate) ÷ lead spend
Illustrative example: three proposals worth $180,000, $240,000 and $90,000 in contract value, with a 25% historical proposal-to-signed rate and 20% gross margin. Expected margin = (510,000 × 0.25 × 0.20) = $25,500 from $12,000 of leads. Track whether the expected value converts as proposals close, and update your proposal-to-signed rate as data arrives.
Commercial ROI differences to plan for
- Engineering cost is real acquisition cost. Site assessments, interval data analysis and proposal modelling take skilled hours. Put them in the stack.
- Project size distribution matters more than averages. One large project can carry a whole year of lead spend. Report median and range, not only the mean.
- Incentives and tax treatment differ. Business credits and depreciation have their own rules and deadlines that change project economics. Have the customer's tax advisor confirm specifics; do not model them as certain.
- Decision makers multiply. Owners, CFOs, landlords and boards each add time. Count every meeting as a stage cost.
For product detail on business leads, see commercial solar leads.
How do market and state differences change lead ROI?
Market conditions change lead ROI through every stage of the funnel: electricity prices and net metering rules shape homeowner interest and close rate, competition affects contact and price pressure, and permitting and interconnection speed change cash timing. Never copy a cost per sale from one state to another. Measure each territory separately, and recompute when local rules change.
Which market factors hit which stage
| Factor | Stage most affected | Direction to check |
|---|---|---|
| Retail electricity prices | Set and close | Higher bills usually mean more motivated homeowners and stronger savings cases |
| Net metering or net billing rules | Close and margin | Less generous export credit can shift buyers toward batteries and change system design |
| Installer density | Contact and close | More installers competing for the same homeowners lowers contact on shared leads and pressures price |
| Permitting and interconnection speed | Cash timing and cancellations | Slow offices lengthen the gap to payment and can raise cancellations |
| Home values and credit profiles | Close (financing approval) | Financing approval rates change close rate directly |
| Local labor cost | Margin | Higher install labor lowers gross margin and the price ceiling for leads |
The U.S. Energy Information Administration publishes average retail electricity prices by state in its Electric Power Monthly, a neutral starting point for comparing the savings case across territories. Pair it with your own close rates by territory; the price data tells you why rates may differ, and your CRM tells you whether they do.
How to model a new territory
- Start from your home-market rates.
- Lower the close rate assumption where you have no brand presence or reviews.
- Adjust margin for local labor, permitting cost and typical system size.
- Re-run the ceiling price per lead with the adjusted numbers.
- Compare the vendor's quoted price for those ZIP codes with the new ceiling.
Lead prices differ by state as well; see what solar leads cost in your state. Pricing for your ZIP codes is confirmed on your call.
Policy changes as ROI events
Treat any rule change in a territory as a reason to re-baseline. Examples include the end of the 25D credit for systems placed in service after 2025, changes to net metering or export credit rules, new utility fixed charges, and changes to state solar contract disclosure rules. After any of those, your old 90-day baseline describes a market that no longer exists. Start a fresh one.
How much does closer performance change lead ROI?
Closer performance changes lead ROI as much as lead quality does, because close rate multiplies through cost per sale. If one closer closes 35% of sits and another closes 20%, the same lead costs 75% more per sale in the second closer's hands. Measure close rate by closer, route leads deliberately, and never judge a source by sits that went mostly to one rep.

Worked example: same leads, different closers
Illustrative example. Hypothetical inputs. Exclusive leads at $160, 70% contact, 35% set, 70% sit.
| Closer | Close rate on held appointments | Lead cost per sale |
|---|---|---|
| Closer 1 | 35% | $2,666 |
| Closer 2 | 30% | $3,110 |
| Closer 3 | 20% | $4,665 |
If the break-even lead cost per sale is $3,500, Closer 3 loses money on every lead routed to them, while Closers 1 and 2 make money on the same source. Average the three and the source looks marginal. Split them and the decision is clear: the source is fine; the routing and coaching need work.
Closer-neutral source comparison
To judge a source fairly, remove closer mix from the comparison:
- Calculate each closer's close rate across all sources over 90 days.
- For each source, calculate the expected close rate given which closers ran its sits (weighted by sits).
- Compare the source's actual close rate with its expected close rate.
Illustrative example: Source X's sits went 60% to Closer 3 and 40% to Closer 1. Expected close rate = 0.6 × 20% + 0.4 × 35% = 26%. If Source X closed 27%, the source performed slightly above what its closer mix predicts, even though its raw close rate is below the 30% team average.
Routing rules that protect ROI
- Send the most expensive units to proven closers. Appointments and live transfers cost the most per unit; route them where close rates are highest.
- Give new closers a defined share. New closers need sits to learn. Give them a fixed share and track their curve, rather than letting them absorb whatever is left over.
- Rotate fairly within a tier. Closers who receive only weak territories will look worse. Rotate ZIP codes within a performance tier.
- Review lost-deal reasons by closer. "Price too high" from one closer and "went with competitor" from another may describe the same problem with different words. Listen to recorded consultations where permitted.
Proposal practices that move close rate
These are habits worth testing; measure the effect on your own close rate rather than assuming it.
- Same-day proposals. A proposal delivered at the table or within hours removes days for the homeowner to collect more quotes.
- Financing pre-checks. Discussing financing options and running a soft check (where offered) before the full proposal prevents signed deals that cancel at approval.
- Bill-based sizing. Using the homeowner's actual 12-month usage instead of an estimate makes the savings case credible after 25D, when the numbers have less room.
- Battery option clearly priced. Where export rules have changed, a separate battery line lets the homeowner choose without restarting the proposal.
Which setter and confirmation scripts protect lead ROI?
Setter scripts protect ROI by lifting the two cheapest stages to fix: appointment set and sit. A good script confirms the homeowner made the request, qualifies quickly, offers two specific times and books every decision maker. Confirmation scripts cut no-shows. Keep scripts short, consistent with the consent you hold, and reviewed by counsel for your state.
The full follow-up cadence belongs in our speed-to-lead guide. The scripts below focus on the moments that change ROI math directly. Treat them as starting points and adapt them to your voice and your legal review.
First call opener (new web lead)
"Hi, is this [first name]? This is [your name] with [company]. You asked about solar for your home on [street name] a few minutes ago, so I'm calling to follow up. Is now an OK time for two quick questions?"
Why it works for ROI: naming the street and the request confirms the lead is real and that you are the company named in the consent, which reduces "I never asked for this" endings. Asking permission keeps the call calm.
Fast qualification (four questions)
- "Do you own the home?"
- "Roughly what's your average monthly electric bill?"
- "Is the roof in good shape, or is it due for replacement in the next few years?"
- "Besides you, who else would be part of the decision?"
Each question protects a later stage. Ownership and bill size protect close rate. Roof condition prevents cancellations after a site survey. The decision-maker question protects sit rate.
Booking with two times
"I can have [closer name] come out [day] at [time] or [day] at [time]. Which works better for you and [other decision maker]?"
Two specific options book more often than "When works for you?" Book within 48 to 72 hours where possible; long gaps raise no-shows.
Day-before confirmation
"Hi [first name], it's [your name] from [company]. Just confirming [closer name] will be there tomorrow at [time] to go over your solar options. Could you have a recent electric bill handy? Will [other decision maker] be able to join?"
Asking for the bill gives the homeowner a small task, which tends to increase commitment, and it improves the proposal. Asking again about the second decision maker catches problems a day early, when you can still move the appointment instead of losing a sit.
No-show recovery
"Hi [first name], [closer name] stopped by at [time] but must have just missed you. No problem at all. Would later today or tomorrow at [time] be better?"
No blame, an immediate new option. Track recovered no-shows separately: a no-show that is rebooked and held is a sit at the cost of one extra call. If you buy booked appointments, report the original no-show under the vendor's replacement policy as well, within the window.
Script compliance checks
- Call only within the consent you hold and the hours allowed in the homeowner's state.
- Honor any request to stop calling immediately and record it.
- Do not use prerecorded or artificial voice messages unless counsel has confirmed you hold the consent they require.
- Keep a copy of the consent record ID on the lead record; ours carry a timestamped certificate whose disclosure names your company, sent on request.
Confirm all of the above with counsel; this is not legal advice.
How should you run a monthly lead ROI review?
Run a 45-minute monthly review with the owner, sales manager and whoever manages lead buying. Look at each source's stage rates against baseline, cost per held appointment, cohort sales at 30, 60 and 90 days, and full acquisition cost per sale. End with one decision per source: scale, hold, fix or stop. Write it down.
The weekly scorecard catches problems early. The monthly review makes the money decisions. Keep them separate so the weekly meeting stays about handling and the monthly one stays about budget.

Agenda
- Five minutes: capacity. Closer calendar fill, setter load, install backlog. If the install backlog is long, buying more leads only lengthens the gap to payment.
- Ten minutes: stage rates by source. Contact, set, sit and close against each source's lead-type baseline. Flag anything more than 10 points off.
- Ten minutes: cohorts. Each source's cohorts at 30, 60 and 90 days, compared at the same age.
- Ten minutes: full acquisition cost per sale for cohorts that have reached 90 days, against break-even and the ceiling.
- Five minutes: credits and vendor issues. Claims filed, approved and denied; any consent or filter concerns.
- Five minutes: decisions. One per source, with an owner and a date.
Monthly scorecard template
| Column | Formula or source |
|---|---|
| Source and lead type | CRM picklists |
| Units received | Count by received date in the month |
| Credits approved | Count of approved replacement claims |
| Net spend | Invoiced spend minus credit value |
| Median minutes to first call | First call attempt timestamp minus received timestamp |
| Contact, set, sit rates | Stage counts ÷ prior-stage counts, using the fixed definitions |
| Cost per held appointment | Net spend ÷ held appointments |
| Cohort sales at 30/60/90 days | Non-cancelled sales from leads received in the cohort month |
| Lead cost per sale (90-day cohort) | Net spend of that cohort ÷ its 90-day sales |
| Full acquisition cost per sale | Lead cost per sale + setter, closer, travel and software per sale |
| Margin after acquisition | Blended gross margin per job − full acquisition cost per sale |
| Decision | Scale / hold / fix / stop, with owner and date |
Decision rules
| Decision | When | Action |
|---|---|---|
| Scale | Full acquisition cost per sale well below break-even for two mature cohorts; capacity available | Raise volume 25% to 50%; add setter or closer capacity first if needed |
| Hold | Near break-even, or only one mature cohort | Keep volume; collect another cohort |
| Fix | One stage well below baseline with a known internal cause | Fix handling, routing or filters; recheck next month |
| Stop | Above break-even for two mature cohorts with handling confirmed normal, or any unresolved consent concern | End or pause the source; consider a different lead type with the same vendor |
Keep a decision log
Write each decision, the numbers behind it and the date in a shared log. Three months later, when someone asks why a source was cut, the answer is on paper. A log also shows patterns: if you "fix" the same source four months running, it is time to stop.
How do you build a lead ROI spreadsheet?
Build a lead ROI spreadsheet with one input block per source (price, the four stage rates, setter minutes per lead, credits), one shared block for margin and non-lead costs, and calculated rows for lead-to-sale rate, leads per sale, lead cost per sale, full acquisition cost and margin after acquisition. Add a low, base and high case for every source.
The solar lead cost calculator handles the core formula quickly. A spreadsheet lets you add your labor costs, credit rates and margin mix, and keep scenarios side by side.
Input block per source
| Cell label | Example value (illustrative) | Notes |
|---|---|---|
| Price per unit | $160 | Per lead, per transfer or per booked appointment |
| Unit type | Lead | Lead, transfer or appointment; controls which rates apply |
| Contact rate | 70% | Leave at 100% for transfers and appointments |
| Set rate | 35% | Leave at 100% for appointments |
| Sit rate | 70% | Held ÷ set |
| Close rate | 30% | Non-cancelled sales ÷ held |
| Bad-data share | 8% | Units with bad numbers or outside filters |
| Credit approval rate | 75% | Approved claims ÷ claims filed |
| Setter minutes per unit | 25 | From dialer reports |
Shared block
| Cell label | Example value (illustrative) |
|---|---|
| Loaded setter cost per hour | $25 |
| Closer commission per sale | $2,000 |
| Closer pay per sit (if any) | $0 |
| Travel and design per sit | $60 |
| Software per sale | $20 |
| Blended gross margin per job | $9,200 |
| Required profit per job | $2,500 |
Calculated rows
Write these as formulas that reference the cells above. Plain-language versions:
- Usable units per unit bought = 1 − bad-data share + (bad-data share × credit approval rate)
- Net price per usable unit = price ÷ usable units per unit bought
- Lead-to-sale rate = contact × set × sit × close
- Units per sale = 1 ÷ lead-to-sale rate
- Lead cost per sale = net price per usable unit × units per sale
- Setter labor per sale = units per sale × setter minutes ÷ 60 × loaded setter cost
- Sits per sale = 1 ÷ close rate
- Closer and travel per sale = commission + sits per sale × (per-sit pay + travel and design)
- Full acquisition cost per sale = rows 5 + 6 + 8 + software
- Margin after acquisition = blended gross margin − row 9
- Profit vs target = row 10 − required profit
- Ceiling price per unit = (blended margin − required profit − rows 6, 8 and software) × lead-to-sale rate × usable units per unit bought
Worked example: the spreadsheet in use
Illustrative example using the example values above.
- Usable units per unit bought = 1 − 0.08 + 0.08 × 0.75 = 0.98
- Net price per usable unit = 160 ÷ 0.98 = $163.27
- Lead-to-sale = 0.7 × 0.35 × 0.7 × 0.3 = 5.145%
- Units per sale = 19.44
- Lead cost per sale = 163.27 × 19.44 = $3,174
- Setter labor = 19.44 × 25 ÷ 60 × 25 = $202
- Sits per sale = 3.33
- Closer and travel = 2,000 + 3.33 × 60 = $2,200
- Full acquisition cost = 3,174 + 202 + 2,200 + 20 = $5,596
- Margin after acquisition = 9,200 − 5,596 = $3,604
- Profit vs target = 3,604 − 2,500 = +$1,104
- Ceiling price per unit = (9,200 − 2,500 − 202 − 2,200 − 20) × 0.05145 × 0.98 = 4,278 × 0.0504 = about $216
In this illustrative case the source clears target profit by about $1,100 per sale, and the vendor price is about three-quarters of the ceiling, which fits the safety-margin rule from the break-even section.
Low, base and high cases
Copy the input block twice per source. In the low case, drop each stage rate by about 15% of its value (70% contact becomes about 60%). In the high case, raise each by about 10%. If the source only clears target profit in the high case, treat it as a small test, not a core source.
Which vendor terms change your lead ROI?
Vendor terms change ROI as much as price. Exclusivity, replacement windows and covered reasons, filter accuracy, delivery speed, consent records and contract length all flow into the stage rates or the net cost per usable lead. Get each term in writing before buying, and model the ones that affect math, such as credits, directly in your spreadsheet.
The vendor vetting guide covers due diligence in full. This section ties each term to the part of the ROI formula it moves.
Term-by-term effect on the formula
| Term | Part of the formula it moves | What to get in writing |
|---|---|---|
| Exclusivity | Contact and close rates | Whether a lead is ever sold to another company, recycled or later sold as aged |
| Replacement policy | Net cost per usable lead | Covered reasons, excluded reasons, window, how to file |
| Filters | Set and close rates; credit volume | ZIP codes, homeowner status, bill size, roof and property type, and how filter misses are credited |
| Delivery method and speed | Contact rate | Real-time delivery into your CRM or dialer, with timestamps |
| Quality checks | Contact rate and bad-data share | Which checks run before delivery, stated plainly |
| Consent records | Compliance risk (not in the formula, but can outweigh it) | Whether each lead has a timestamped consent record naming your company, and how to get it |
| Contract length and minimums | How quickly you can stop a losing source | Minimum spend, notice periods, test batch options |
| Pricing basis | Price per unit | Per lead, per billable transfer, per booked or per held appointment |
How our terms map to the formula
These are our stated terms, so you can model them directly:
- Exclusivity: each exclusive lead is sold to one company. It is never resold, recycled or sold later as an aged lead.
- Replacement: replacement credits for disconnected numbers, wrong contact details, or leads outside your filters, within 7 days. Not covered: a prospect who isn't interested, doesn't answer, doesn't get financing approved, or doesn't buy. To claim, reply to the lead notification (or email us) with the reason; approved credits apply to your next batch.
- Appointments: if a confirmed appointment doesn't sit because the prospect no-shows or doesn't match your filters, report it within 7 days of the scheduled time and we replace it.
- Quality checks: phone number validated before delivery; homeowner status self-reported, then checked against property records; duplicate-checked against leads already sent to you; scrubbed against the National Do Not Call Registry.
- Delivery: real-time delivery to your CRM, dialer, email, or SMS.
- Consent: every lead carries a timestamped consent record (certificate) whose disclosure names your company. We send it to you on request.
- Contract: no long-term contracts. Start with a test batch, scale when the numbers work.
- Coverage and price: territory availability is confirmed by ZIP code on your call, and pricing is confirmed by ZIP on your call.
In the spreadsheet, the replacement policy sets the bad-data share and credit approval inputs, and the appointment policy raises the effective sit rate on paid appointments. Measure both from your own claims log rather than assuming them.
Questions that expose ROI risk on a vendor call
- "If a lead's phone number is disconnected, what happens, and how fast?"
- "Which reasons are not covered by replacement?"
- "Is any lead you send me ever sold to anyone else, now or later?"
- "Can I see a sample consent record with my company named?"
- "What is the smallest test batch you will sell, and can you pace it daily?"
- "How do you price: per lead, per billable call, per booked or per held appointment?"
- "What happens if I need to pause for two weeks?"
If the answers are vague, put a lower ceiling on the price you will pay. Uncertainty is a cost.
How should you split a lead budget across sources?
Split a lead budget by marginal cost per sale, not average. Fund the source with the lowest full acquisition cost per sale first, up to the volume your team can work without contact rate falling, then move to the next source. Re-rank every month, because each source's cost per sale rises as you push more volume through it.
Why averages mislead
A source's average cost per sale describes the volume you bought. The next 50 leads may cost more per sale, because setters are fuller, the vendor reaches further for volume, or your closers' calendars are booked out. The question for each extra dollar is "what will the next sale cost from this source?"
Worked example: allocating a fixed budget
Illustrative example. Hypothetical numbers. The installer has $40,000 a month for leads and three tested sources. Marginal full acquisition cost per sale rises at higher volume.
| Source | Tier 1 (first $10,000) | Tier 2 (next $10,000) | Tier 3 (next $10,000) |
|---|---|---|---|
| Appointments | $3,700 | $4,300 (closer calendars fill) | $5,600 (new closer needed) |
| Exclusive leads | $5,300 | $5,600 | $6,500 (setters overloaded) |
| Live transfers | $4,100 | $5,900 (after-hours calls missed) | Not available at this volume |
Fund in order of the cheapest next tier:
- Appointments tier 1: $3,700
- Live transfers tier 1: $4,100
- Appointments tier 2: $4,300
- Exclusive leads tier 1: $5,300
That spends the $40,000. The next candidates (exclusive tier 2 at $5,600 and appointments tier 3 at $5,600) only make sense if the budget grows and margin clears them. Notice that the allocation leaves live transfers at one tier because the second tier depends on after-hours coverage you do not have. Fixing that coverage would change the ranking.
Rules for allocation
- Rank on full acquisition cost per sale, including labor, not on lead cost alone.
- Use tiers from your own data. Watch how stage rates moved the last time you stepped a source up.
- Keep a test slice. Hold 10% to 15% of budget for testing new sources or lead types, so the ranking does not freeze.
- Fix capacity, then re-rank. Often the cheapest way to lower marginal cost is a hire, a calendar change or after-hours coverage, not a new vendor.
How does seasonality affect lead ROI?
Seasonality changes contact, sit and close rates, and the time from sale to install, so a source can look worse in one month for reasons unrelated to quality. Compare each month with the same season in prior years when you have the data, and adjust volume ahead of slow periods rather than judging sources inside them.
Seasonal effects to check in your data
| Period | Stages often affected | What to check |
|---|---|---|
| Late-year holidays | Contact and sit | No-shows around holidays; homeowners delaying decisions to the new year |
| Winter in snowy regions | Install timing; cash flow | Longer gap from sale to install; some buyers wait for spring |
| Summer bill peaks in hot regions | Set and close | High bills can lift motivation; check whether set rate rises |
| Summer travel | Sit | Rescheduled appointments and missing decision makers |
| Tax and incentive deadlines | Close and cancellations | Rushes before a deadline, slumps after; the 25D end at 2025 is an example |
These are things to test, not rules. Your territory may behave differently. If you do not have a year of data yet, note each month's conditions in the decision log so you can compare next year.
Planning around a slow season
- Lower volume before the slowdown, not after you see weak cohorts.
- Shift mix toward appointments if closers have open time but setters are struggling to reach people.
- Use the slow period to fix the funnel: script reviews, CRM cleanup, closer training.
- Do not judge a source on a holiday cohort alone. Wait for a normal month before deciding.
What should you do when lead ROI drops?
When lead ROI drops, find which stage moved before changing anything. Check response time, closer mix, territory mix and seasonality first, because internal causes are common and cheaper to fix than switching vendors. If stage rates fell with handling unchanged, bring specific evidence to the vendor, claim credits for filter misses, and reduce volume while you investigate.
Troubleshooting table
| Symptom | First check | Likely fix |
|---|---|---|
| Contact rate down across all sources | Caller ID reputation; dialer settings; staffing | Monitor and rotate registered numbers within carrier rules; restore staffing |
| Contact rate down for one source only | Delivery timestamps; bad-number share | Fix delivery integration; file credits; ask vendor about number validation |
| Many contacts deny submitting a form | Consent records and form pages for those leads | Pause the source; request records; confirm with counsel before resuming |
| Set rate down, contact steady | Filter match on a sample of leads; script changes | Claim filter misses; revert script changes; tighten filters |
| Sit rate down | Booking-to-meeting lag; confirmation calls made | Book sooner; enforce day-before and day-of confirmations |
| Close rate down for one closer | Recorded consultations; lost-deal reasons | Coaching; reroute expensive units to proven closers |
| Close rate down for all closers | Pricing changes; financing approvals; local policy change | Re-run break-even; review financing partners; re-baseline |
| Cancellations up | Cancellation reasons; time from signing to survey | Pre-qualify roof and financing before signing; shorten time to survey |
| Credits denied often | Claim timing and reason codes | File daily inside the window; use the vendor's covered reasons exactly |
| Costs fine, cash tight | Install backlog; milestone payment timing | Slow volume growth; review payment terms; fund the trough first |
Talking to a vendor about a drop
Bring numbers, not impressions:
- The stage rates for the period and your baseline.
- Median minutes to first call (to show handling was normal).
- A list of specific leads with problems, with reasons.
- Credits filed, approved and denied.
Ask what changed on their side: sourcing, form pages, filters, volume. A good vendor will look into it. If the answers are vague and the numbers do not recover after handling is confirmed normal, move the budget.
How do lead ROI goals differ by sales team role?
Each role controls part of the formula, so each should own one or two numbers. Setters own contact and set rates and response time. Confirmers own sit rate. Closers own close and cancellation rates. The person buying leads owns net cost per usable lead and source mix. The owner holds full acquisition cost per sale against margin.
| Role | Owns | Weekly number to report |
|---|---|---|
| Setter | Response time, contact rate, set rate | Median minutes to first call; contact and set rate by source |
| Confirmer or setter | Sit rate | Held ÷ booked for appointments whose date has passed |
| Closer | Close rate, cancellations | Non-cancelled sales ÷ held appointments; cancellation reasons |
| Lead buyer or ops | Net cost per usable lead, filters, credits, mix | Credits filed and approved; net spend by source |
| Owner or sales manager | Full acquisition cost per sale vs margin | Monthly scorecard decisions |
Pay plans and ROI
Pay plans shape behavior at each stage. If setters are paid per appointment booked, sit rate can fall as they book weak appointments. Paying on held appointments, or adding a sit-rate threshold, aligns setters with ROI. If closers are paid on signed contracts with no clawback, cancellations can climb; paying on contracts that pass cancellation and financing aligns closers with the cancellation-adjusted close rate used throughout this guide. Review pay plan changes with your accountant and employment counsel.
Solar lead ROI glossary
These are the terms used in this guide, defined the way the formulas use them. Keep the same definitions in your CRM so your numbers stay comparable over time.
| Term | Definition in this guide |
|---|---|
| Contact rate | Leads with a live two-way conversation with the person who submitted the form ÷ leads received |
| Appointment set rate | Appointments booked for a specific date and time ÷ leads contacted |
| Sit rate | Appointments held with decision makers present ÷ appointments set |
| Close rate | Contracts signed and not cancelled, with financing approved ÷ appointments held |
| Lead-to-sale rate | Contact × set × sit × close |
| Units per sale | 1 ÷ lead-to-sale rate (or the matching product for transfers and appointments) |
| Lead cost per sale | Net lead spend ÷ non-cancelled sales |
| Full acquisition cost per sale | Lead cost per sale + setter, closer, travel, design and software cost per sale |
| Gross margin per job | Contract revenue minus equipment, install labor, permits, interconnection and dealer fees |
| Blended margin | Gross margin per job weighted by your mix of cash, loan and third-party-owned sales |
| Break-even lead cost per sale | Gross margin − non-lead acquisition cost − required profit |
| Ceiling price | Break-even lead cost per sale × units converted per sale, adjusted for credits |
| Cost per held appointment | Net spend ÷ appointments held; the earliest number that carries most of the funnel |
| Cohort | All leads received in one period, followed together over time |
| Net cost per usable lead | Spend ÷ (leads received − bad leads + approved replacements) |
| Replacement credit | A replacement or credit a vendor grants for a covered reason within its window |
| Exclusive lead | A lead sold to one company only |
| Shared lead | A lead sold to more than one company |
| Aged lead | An older lead record sold at a lower price, often after its first sale |
| Live transfer | A screened homeowner connected to your team by phone, usually billed after a minimum call length |
| Booked appointment | A meeting scheduled by the vendor with a homeowner who meets your filters |
| Speed to lead | Time from lead receipt to first call attempt |
| Third-party ownership (TPO) | Lease or PPA where a financier owns the system |
| Marginal cost per sale | Cost of the next sale from a source at higher volume, as opposed to the average |
How do bought leads compare with your own marketing on ROI?
Compare bought leads with your own channels (website, paid search, social ads, door knocking, events and referrals) using the same four stages and the same full acquisition cost per sale. Your own channels carry hidden costs such as agency fees, ad management time, canvasser pay and content production. Put all of it in the stack, then rank channels side by side.
Owners often treat in-house leads as free and bought leads as expensive. Neither is accurate. A website lead has a cost per lead too: ad spend plus management time plus the site itself, spread over the leads it produces.
Cost per lead for in-house channels
| Channel | Costs to include | Divide by |
|---|---|---|
| Paid search and social ads | Ad spend, agency or freelancer fees, staff time managing campaigns, landing page tools | Leads from the channel in the period |
| Organic website and content | Writing, design and development time or fees, hosting, SEO tools | Leads from organic search over the same period (expect a long lag) |
| Door knocking | Canvasser pay and bonuses, training, travel, tablets, permits where required | Conversations that become appointments (canvassing often skips the web lead stage) |
| Home shows and events | Booth fees, staff time, materials, travel | Leads captured at the event |
| Referral program | Referral bonuses, gifts, program software, staff time | Referred leads |
| Partnerships (roofers, electricians, realtors) | Referral fees, co-marketing, relationship time | Leads from partners |
Some of these channels need legal review of their own, such as referral fee arrangements and canvassing permits. Confirm with counsel for your state.
Worked example: four channels on one basis
Illustrative example. Hypothetical inputs for one month at a mid-size installer.
| Channel | Monthly cost | Leads | Sales (90-day cohort) | Channel cost per sale | Setter + closer + travel per sale | Full cost per sale |
|---|---|---|---|---|---|---|
| Referrals | $3,000 (bonuses + admin) | 15 | 4 | $750 | $2,150 | $2,900 |
| Paid search (in-house) | $14,000 (ads + management) | 90 | 4 | $3,500 | $2,450 | $5,950 |
| Bought exclusive leads | $16,000 | 100 | 5 | $3,200 | $2,420 | $5,620 |
| Door knocking | $12,000 (canvasser pay + travel) | 40 appointments | 6 | $2,000 | $2,200 | $4,200 |
Referrals win in this example, as they usually do, but they cannot be bought at volume. The useful comparison is between the channels you can scale. Here, bought exclusive leads and paid search land close together; door knocking looks cheaper but depends on finding and keeping canvassers. A blended plan that keeps referrals growing and uses bought leads and ads to fill the calendar is common for this reason.
Hidden costs people forget
- Your own time. If the owner spends ten hours a week managing ads, that is a real cost, even if no invoice arrives.
- Learning periods. New ad campaigns often run at higher cost per lead for weeks while they are tuned. Spread that cost over the campaign's life.
- Canvasser turnover. Recruiting and training replacements belongs in door-knocking cost.
- Attribution leakage. A homeowner who saw your ad, then found you on a review site, may be logged as "organic." Use a "how did you hear about us" field as well as tracking links.
When bought leads beat building your own
- You need volume within weeks, not months.
- You are entering a territory where you have no brand or reviews.
- You do not have the staff or budget to run ads well.
- You want to test demand in new ZIP codes before committing to local marketing.
When your own channels are mature and cheaper per sale, bought leads still fill gaps: slow seasons, new closers who need appointments, or a backlog that ends early. Keep measuring them on the same basis.
How do battery and add-on leads change the ROI math?
Battery, EV charger and panel upgrade leads follow the same formula but with different margin, sales cycle and qualification. Leads from existing solar owners for a battery retrofit can carry lower setter effort and a different close rate than new-system leads. Model them as their own lead type with their own break-even, and track existing-customer add-ons separately from bought add-on leads.
Why add-on leads need their own model
- Margin per job is different. A battery-only or charger-only job usually earns a different gross margin than a full system. Use your actual numbers.
- Qualification is different. A battery retrofit lead needs an existing system, compatible inverter or a plan for one, and a reason (outages, export credit changes, time-of-use rates).
- The sales cycle can be shorter or longer. Some homeowners decide after one visit; others wait for utility programs or price changes.
- Equipment compatibility affects cancellations. A retrofit that fails a compatibility check after signing becomes a cancellation. Check before the sit.
Worked example: battery retrofit leads
Illustrative example. Hypothetical inputs.
- Lead price: $90 (hypothetical)
- Contact 65%, set 40%, sit 75%, close 35%
- Lead-to-sale rate = 0.65 × 0.40 × 0.75 × 0.35 = 6.8%
- Leads per sale = 14.7
- Lead cost per sale = $90 × 14.7 = $1,319
If gross margin on a retrofit is $4,000 (hypothetical) and non-lead acquisition cost is $1,200, the margin after acquisition is $4,000 − $1,319 − $1,200 = $1,481. That may clear your target, but the ceiling is far lower than for full systems. With a required profit of $1,500, maximum lead cost per sale = $4,000 − $1,200 − $1,500 = $1,300, so the ceiling price per lead is $1,300 × 0.068 = about $89. A $90 lead sits just over it, so this would be a test-small decision.
Your own customers first
Before buying add-on leads, work your own installed base. Existing customers already trust you and you know their equipment. Track add-on sales to existing customers back to the original lead source; that is the lifetime value effect described earlier, and it raises what the original source was worth.
What does a one-page lead ROI checklist look like?
A one-page lead ROI checklist covers four phases: before buying (definitions, margin, ceiling, capacity), during the test (pacing, response time, credits), at review (stage rates, cohorts, full acquisition cost) and at scale (step increases, marginal cost, re-baselining). Print it and run it for every new source and every quarterly review.
Before you buy
- Four stage definitions written and set in the CRM
- Cancellation-adjusted close definition agreed
- Blended gross margin per job calculated from your current financing mix
- Non-lead acquisition cost per sale estimated (setter, closer, travel, software)
- Required profit per job set
- Maximum lead cost per sale and ceiling price per unit calculated
- Walk-away price set at 75% to 85% of ceiling
- Test batch sized for 20 to 25 held appointments
- Setter and closer capacity confirmed for the daily pace
- Filters, replacement terms, consent records and pricing basis in writing
During the test
- Every lead tagged with source, lead type, cost and received timestamp
- Median minutes to first call tracked daily
- Bad leads reported daily inside the replacement window
- Appointments confirmed the day before and the day of
- No-shows on paid appointments reported within the window
- Day 7 and day 21 checkpoints run against agreed thresholds
At review
- Stage rates compared with lead-type baseline
- Closer mix and territory mix checked
- Cost per held appointment compared with target
- Cohort sales compared at the same age
- Full acquisition cost per sale compared with break-even (from day 60 to 90)
- Decision recorded: scale, hold, fix or stop
At scale
- Volume raised in steps of 25% to 50%, held a month each
- Capacity added before each step
- Marginal cost per sale tracked by tier
- Test slice of 10% to 15% of budget kept for new sources
- Baselines reset after any policy, pricing or financing change
- Working capital for three months of lead spend in place
Quarterly
- Blended margin recalculated for financing mix
- Ceiling prices recalculated
- Each source re-ranked on full acquisition cost per sale
- Lifetime value assumptions checked against tracked referral and add-on sales
- Consent and compliance questions reviewed with counsel
How do you explain lead ROI to a partner, lender or investor?
Explain lead ROI to a partner, lender or investor with four numbers per source: full acquisition cost per sale, blended gross margin per job, margin after acquisition, and months from lead spend to cash. Show cohort tables rather than monthly totals, state your stage definitions, and label any projection as a projection. Outsiders trust tracked cohorts far more than averages.
Owners who buy leads at scale eventually need to justify the spend to someone: a business partner, a bank reviewing a line of credit, or an investor. The same discipline that keeps the monthly review honest makes that conversation short.
What to show
| Item | What it answers | Where it comes from |
|---|---|---|
| Stage definitions | "Can I compare these numbers to anything?" | Your CRM rules, written down |
| Cohort table per source | "Is this stable or a lucky month?" | Cohort tracking at 30, 60, 90 days |
| Full acquisition cost per sale | "What does a customer cost?" | Monthly scorecard |
| Blended gross margin per job | "What does a customer earn?" | Job costing by financing type |
| Margin after acquisition | "Is each sale profitable after selling costs?" | Margin minus full acquisition cost |
| Cash timing | "How much working capital does growth need?" | Lead-to-cash timeline and cash flow table |
| Sensitivity | "What happens if rates slip?" | Low, base and high cases from your spreadsheet |
Worked example: a one-paragraph summary
Illustrative example. Hypothetical numbers.
"Over the last three mature cohorts, exclusive leads cost $5,500 to $5,700 per non-cancelled sale including setter, commission, travel and software. Blended gross margin is $9,200 per job at our current financing mix, leaving about $3,600 per sale after acquisition. Each $16,000 monthly buy needs about three months of working capital before installs pay. In our low case (each stage rate 15% worse), margin after acquisition falls to about $500 per sale, barely positive, so we hold volume until two more cohorts confirm the base case, then raise it 25% after hiring one setter."
That paragraph names its definitions, gives ranges rather than a single best number, includes a downside case and ties growth to capacity. Those four features are what a careful reader looks for. Notice, too, how thin the low case is: four rates that each slip 15% cut lead-to-sale by almost half, which is why the downside case belongs in every summary.
What not to do
- Do not quote vendor benchmarks as your results. Use your own cohorts. If you have none yet, say so and present a test plan.
- Do not show signed contracts as sales. Use the cancellation-adjusted figure.
- Do not hide labor. A lender who later sees payroll will recompute the number anyway.
- Do not extrapolate one month. One good cohort is a signal, not a trend.
Where projections fit
Projections are useful for planning volume and cash, as long as they are labelled and built from tracked rates. A simple projection multiplies planned units by your measured lead-to-sale rate for the source, applies your measured cancellation share, and lays sales onto your lead-to-cash timeline. Show the low case next to the base case every time.
How do you use the solar lead cost calculator?
The solar lead cost calculator takes your price per lead and your four funnel rates and returns leads needed per sale and lead cost per sale. Enter your own tracked rates where you have them, test ranges where you do not, and compare lead types on the result rather than the price.
How to read results
- Leads per sale tells you the volume your setters must work. If it is higher than your team can call within minutes, you will not hit the modeled rates.
- Lead cost per sale is what you compare across sources and against your break-even.
- Run a low and a high case. If a source only works at your best-case rates, it is risky.
- Compare against margin, not against other prices. A source is good if it clears your break-even with room to spare.
When your numbers show a source worth testing, book a call. Pricing is confirmed by ZIP on your call, and you can buy solar leads in a small test batch first. For a refresher on market prices by lead type, see solar lead cost, and for market-by-market differences, see what solar leads cost in your state.
FAQ
Are solar leads worth it?
Solar leads are worth it when your lead cost per sale plus sales labor stays below the share of gross margin you allow for acquisition, and your team can call leads within minutes. They are not worth it for teams at capacity, teams that cannot track results by source, or markets with thin margins.
How do you calculate cost per sale for solar leads?
Divide price per lead by the product of contact rate, appointment set rate, sit rate and close rate. For example, a $150 lead with 70% contact, 35% set, 70% sit and 30% close has a lead-to-sale rate of about 5.1% and a lead cost per sale of about $2,915. Those inputs are illustrative.
What is a good solar customer acquisition cost?
A good customer acquisition cost is one that leaves the profit you need after gross margin. LeadGen Economy reports $1,500 to $3,000 per closed sale as a typical range (April 2026), but your target should come from your own margin per job, overhead and financing mix, not an industry figure.
What close rate do solar leads have?
Vendor-reported lead-to-sale rates range from 1% to 3% for aged leads to 8% to 15% for exclusive qualified leads (LeadGen Economy, April 2026), with SolarReviews reporting 3% to 7% on its own leads. Definitions differ by source. Measure your own close rate from held appointments to non-cancelled contracts.
How many solar leads does it take to make a sale?
Leads per sale equals one divided by your lead-to-sale rate. At 2% you need 50 leads per sale; at 5%, 20 leads. Vendor-reported lead-to-sale rates of 3% to 7% (SolarReviews) imply roughly 14 to 33 leads per sale, but your team's speed and the lead type change the answer.
What is a good ROI on solar leads?
A good ROI is any return that clears your required profit after lead cost and sales labor. If acquisition costs $5,000 per sale and gross margin is $9,000, ROI is 80%. Set your minimum before testing, and judge sources on cancellation-adjusted sales tracked for at least 60 to 90 days.
Does speed to lead really affect ROI?
Yes. Contact rate multiplies through the whole funnel, so slow follow-up raises cost per sale at once. In our illustrative sensitivity table, a drop in contact from 70% to 55% added $848 per sale, more than double what a 10% price discount saved. Call within minutes during business hours.
Should I include sales commissions in lead ROI?
Yes. Lead spend is only part of acquisition cost. Add setter wages, closer commissions, and dialer and CRM costs per sale to get a full acquisition cost, then compare it with gross margin. Leaving labor out makes cheap, labor-heavy lead types look better than they are.
How long should I test a lead source before judging ROI?
Test long enough to produce 15 to 25 held appointments, then wait 60 to 90 days for those appointments to close and pass cancellation windows. Judge early progress on cost per held appointment. Judging on sales in the first two weeks almost always undercounts a source's real results.
What is full acquisition cost per sale for solar?
Full acquisition cost per sale is lead cost per sale plus setter labor, closer pay, travel and design time, and software, after subtracting approved replacement credits. In this guide's illustrative exclusive lead example, a $3,110 lead cost per sale becomes about $5,532 once labor and commission are added. Use your own payroll and dialer data.
How many held appointments do I need to judge a lead source?
Aim for 20 to 25 held appointments before reading a close rate. With fewer sits, chance alone swings results widely: at a true 30% close rate, 20 sits can produce anywhere from about 2 to 10 sales. Judge early on contact rate and cost per held appointment, which settle sooner.
What is the maximum I should pay per solar lead?
Your ceiling price per lead equals your maximum lead cost per sale multiplied by your lead-to-sale rate. Maximum lead cost per sale is gross margin minus non-lead acquisition cost and required profit. Set your walk-away price at 75% to 85% of the ceiling so normal monthly swings do not push the source below break-even.
Are aged solar leads good ROI?
Aged leads can show a low lead cost per sale, but they carry heavy setter labor per sale and consent questions because records are older. They make sense mainly when setters have idle capacity and you hold a consent position confirmed by counsel. Compare them on full acquisition cost, not price.
How long before a solar lead batch pays back in cash?
Payback lags spend by the sales cycle plus your install and payment timeline. In this guide's illustrative steady-buy example, the plan needed about three months of lead spend in working capital and turned cash-positive in month six. Your permitting speed, financing types and milestone terms set your actual timing.
Why does the same lead source work for one installer and fail for another?
Because lead price is only one input. Response speed, setter skill, closer close rates, territory, margin per job and financing mix all change cost per sale. In the illustrative closer example, the same lead cost $2,666 per sale with one closer and $4,665 with another. Measure your own rates.
How do I measure ROI on commercial solar leads?
Use commercial stages (contact, discovery meeting, site assessment, proposal, signed contract) and count engineering time as acquisition cost. Because cycles are long, track pipeline value created per lead dollar, using your historical proposal-to-signed rate, until signed projects arrive. Judge on margin per project, not lead price.
What is cost per held appointment and why does it matter?
Cost per held appointment is net lead spend divided by appointments that actually took place with decision makers present. It carries contact, set and sit rates in one number and settles weeks before close rate does. Multiply your maximum lead cost per sale by your baseline close rate to set a target.
Should I compare bought solar leads with my own ads and referrals?
Yes, on the same basis. Count ad spend, agency fees, management time, canvasser pay and referral bonuses as channel costs, then add setter, closer and travel cost per sale. Ranking every channel on full acquisition cost per sale shows where the next dollar earns the most.
How do replacement credits affect solar lead ROI?
Approved credits raise the number of usable leads you get for the same spend, which lowers net cost per usable lead and lead cost per sale. In this guide's illustrative example, six approved replacements on a 100-lead batch saved about $200 per sale. Credits only help if you file inside the window and for covered reasons, so report bad leads daily.
How often should I recalculate my break-even lead price?
Recalculate at least quarterly, and immediately after any change to pricing, financing partners, dealer fees, commission plans or local policy such as net metering rules. The end of the 25D credit for systems placed in service after 2025 is an example: it moved financing mix and margin, and with them the ceiling price you can pay per lead.
What is the difference between lead cost per sale and customer acquisition cost?
Lead cost per sale counts only what you paid for leads, net of credits, divided by non-cancelled sales. Customer acquisition cost adds everything else it took to win the sale: setter time, closer pay, travel, proposal design and software. Use lead cost per sale to compare vendors, and full acquisition cost to decide whether a source is profitable against your margin.