How Much Do Solar Leads Cost in 2026? Prices by Lead Type
Solar lead prices in 2026 by type, from aged and shared to exclusive, live transfer and appointments, with dated sources and the cost-per-sale math behind them.
Updated · 86 min read
In this guide (40 sections)
- How much do solar leads cost? Short answer by lead type
- What drives the price of a solar lead?
- Solar lead price by format
- What pricing models do solar lead vendors use?
- Why does price per lead mislead installers?
- What does a lead cost from your own marketing?
- How does solar lead cost vary by state?
- How has the end of the 25D credit affected lead prices?
- How should an installer budget for lead spend?
- How do you convert a lead price into cost per contact, appointment and sale?
- What does solar lead spend look like by installer size?
- How much do commercial solar leads cost?
- What hidden costs sit on top of the lead price?
- How do returns and credits change the real price of a lead?
- How do you read a solar lead vendor's price sheet?
- How do you negotiate a better price on solar leads?
- How does your sales model change what you can pay per lead?
- How do filters and targeting change what you pay?
- How much do live transfers and inbound calls really cost?
- How do battery storage, system size and financing change what a lead is worth?
- How should you split a lead budget across products?
- How should you run a 90-day lead pilot?
- How should you track solar lead cost each month?
- Illustrative case walkthroughs
- What can you do when leads cost too much in your market?
- How do you price aged leads by the work they need?
- A one-page lead cost policy you can adapt
- How should you run a monthly vendor review?
- Pre-purchase checklist
- Illustrative monthly P&L for a six-rep team
- Why is my cost per sale rising? A troubleshooting guide
- When during the year do lead costs and results shift?
- What questions should you ask before you buy solar leads?
- How does compliance affect what a solar lead costs you?
- Should you buy leads or generate your own?
- How do you build your own solar lead cost benchmark?
- Common myths about solar lead prices
- Glossary of solar lead pricing terms
- How we gathered these numbers
- FAQ
Solar leads cost anywhere from under a dollar to several hundred dollars each, as of October 2026. The spread depends on the type of lead you buy. Public vendor guides put aged leads at roughly $0.10 to $10, shared leads at $25 to $100, exclusive leads at $100 to $250 or more, and booked appointments at $150 to $500. Those are directional numbers published by companies that sell or analyze leads, and this guide names every one of them with a link and a date. The bigger point, which most price pages skip, is that the sticker price per lead tells you very little about what a signed contract costs you. A $40 lead that four other installers are also calling can cost more per sale than a $200 lead that only you receive. We walk through the ranges, what moves them, the pricing models you will run into, and the math that converts price per lead into price per sale.

Key takeaways (as of October 2026)
- Published ranges: aged $0.10 to $10+, shared $25 to $100, real-time $40 to $120, exclusive $100 to $250+, inbound calls $100 to $300+, booked appointments $150 to $500. Sources and dates are in the table below.
- Sources disagree, sometimes by 2x. Treat any single number as a starting point for a test, not a budget.
- Judge leads by cost per sale. A lead's price divided by the product of your contact, appointment, sit and close rates is the number that decides whether a source is profitable.
- The residential 25D credit ended for systems placed in service after 2025, which changes cash and loan buyer economics and puts more pressure on acquisition budgets.
How much do solar leads cost? Short answer by lead type
Solar leads cost between about $0.10 and $500 each in October 2026, depending on lead type. Aged leads sit at the bottom, shared leads at $25 to $100, exclusive leads at $100 to $250 or more, and booked appointments at $150 to $500, according to vendor guides from ActiveProspect, UpLead and LeadGen Economy published in 2025 and 2026.
The table below lists every range we could verify on a public page. We fetched each page in October 2026 and recorded the date it showed. Where a source attributes a number to someone else, we say so, because a figure repeated by three blogs is still one figure.
| Lead type | Reported range (USD) | Source | Source date | Notes |
|---|---|---|---|---|
| Aged lead | $0.10 to $10+ | ActiveProspect | Jul 31, 2026 | Attributed to The Leads Warehouse |
| Aged lead, 30 to 85 days old | $0.60 to $1.50 | UpLead | Updated Oct 2, 2026 | Attributed to Aged Lead Store |
| Aged lead, 30+ days | $5 to $30 | LeadGen Economy | Updated Apr 21, 2026 | Wider band than the other two sources |
| Shared (marketplace) lead | $25 to $100 | ActiveProspect; UpLead | Jul 31, 2026; Oct 2, 2026 | ActiveProspect attributes to Enervio |
| Shared lead, 2 to 3 buyers | $35 to $125 | LeadGen Economy | Updated Apr 21, 2026 | Defines buyer count |
| Shared high-intent lead | $80 to $150 | SolarReviews | No exact date shown | Higher than other shared bands |
| Real-time lead | $40 to $120 | ActiveProspect; UpLead | Jul 31, 2026; Oct 2, 2026 | Attributed to The Leads Warehouse |
| Exclusive lead | $100 to $250 | ActiveProspect; UpLead | Jul 31, 2026; Oct 2, 2026 | ActiveProspect attributes to Enervio |
| Exclusive, qualified lead | $100 to $200+ | LeadGen Economy | Updated Apr 21, 2026 | |
| Exclusive high-intent web lead | $150 to $300 | SolarReviews | No exact date shown | |
| Inbound call / live transfer | $100 to $300+ | ActiveProspect; UpLead | Jul 31, 2026; Oct 2, 2026 | Attributed to The Leads Warehouse |
| Booked appointment | $150 to $500 | ActiveProspect; UpLead | Jul 31, 2026; Oct 2, 2026 | ActiveProspect attributes to Enervio |
| Set appointment | $150 to $200 | LeadGen Economy | Updated Apr 21, 2026 | Narrower band |
| Door-to-door appointment | $200 to $400+ | ActiveProspect | Jul 31, 2026 | Attributed to The Leads Warehouse |
Prices as of October 2026. All figures are vendor-published or vendor-compiled market ranges, not audited transaction data and not our prices.
Where sources disagree
The disagreements are worth reading closely, because they tell you how soft the numbers are.
- Aged leads range from $0.60 to $1.50 in one source (for leads 30 to 85 days old) to $5 to $30 in another (30+ days). That is more than a tenfold difference for what sounds like the same product. The likely explanation is that "aged" covers everything from a lead resold for the fifth time to a lead held back for 31 days and sold once.
- Shared leads appear at $25 to $100 in two sources and $80 to $150 for "shared high-intent" at SolarReviews. The difference may be buyer count, the qualifying questions, or simply which publisher's own inventory the page is describing.
- Exclusive leads top out at $200+, $250, or $300 depending on the source. SolarReviews and UpLead both mention exclusive web leads reaching about $300 in expensive markets such as San Diego.
- Appointments run from a narrow $150 to $200 band (LeadGen Economy) to $150 to $500 (ActiveProspect citing Enervio). Appointment definitions vary more than any other product, which explains most of that gap.
If you remember one thing from this section: a quoted price without a definition of the product is not comparable to any other quoted price.
What drives the price of a solar lead?
Five factors set the price of a solar lead: how many buyers receive it, how old it is, how much qualification happened before delivery, how competitive the market is, and how much volume you commit to. Exclusivity and age move price the most. A fresh exclusive lead in California and a 90-day-old shared lead in Ohio are different products.
Exclusivity
Exclusivity is the number of companies that receive the same homeowner's information. An exclusive lead goes to one buyer. A shared lead goes to several, commonly two to four, and LeadGen Economy describes shared leads as typically going to two or three buyers. The vendor's production cost is roughly the same either way, so a shared lead lets the vendor collect revenue several times over. That is why shared leads are cheaper per unit and why exclusive leads cost more. Our own exclusive solar leads follow one rule: each exclusive lead is sold to one company. It is never resold, recycled or sold later as an aged lead.
Age
Age is the time between the homeowner submitting a form and the lead reaching you. Real-time leads arrive within seconds or minutes. Aged leads are anything a vendor has held or resold, often 30, 60 or 90 days old. Contact rates fall with age, which is why aged leads are cheap. UpLead's page quotes Aged Lead Store contact-rate estimates of 50% to 70% for fresh exclusive leads and 20% to 35% for leads aged 30 to 85 days. Those are vendor estimates, but the direction is consistent everywhere we looked. Read more on aged solar leads before you buy them in bulk.
Intent and qualification
A lead that answered five qualifying questions costs more to produce than one that typed a ZIP code into a banner ad. Common filters include homeownership, property type, average monthly electric bill, roof shade, credit band and timeline. Each question lowers form completion and raises the vendor's cost per lead, but it also screens out people you would never sell. A higher sticker price is often the cost of filtering that you would otherwise pay your setters to do on the phone.
Market and competition
Leads cost more where electricity is expensive, incentives are strong, and many installers bid for the same homeowners. Both SolarReviews and LeadGen Economy put California, Massachusetts, New York and Hawaii at the expensive end and the Dakotas and parts of the Midwest at the cheap end. Paid traffic costs follow the same pattern, because lead vendors buy clicks in the same auctions as installers. We break this down state by state in our guide to solar lead prices by market.
Volume and contract terms
Vendors price volume commitments lower than test batches, and they price flexible delivery (any ZIP in a state) lower than tight territories (twelve ZIP codes around your warehouse). Ask what you give up for each discount. A low price that requires a monthly minimum you cannot work is not a saving. Our terms are simple: no long-term contracts. Start with a test batch, scale when the numbers work.
Solar lead price by format
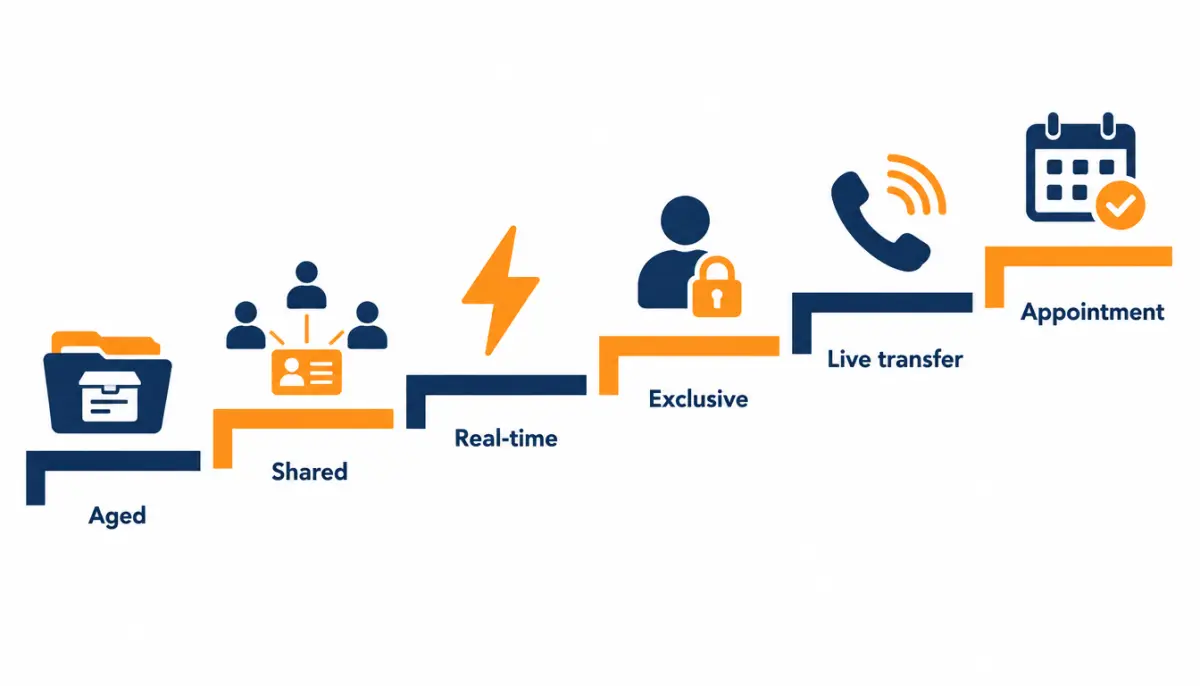
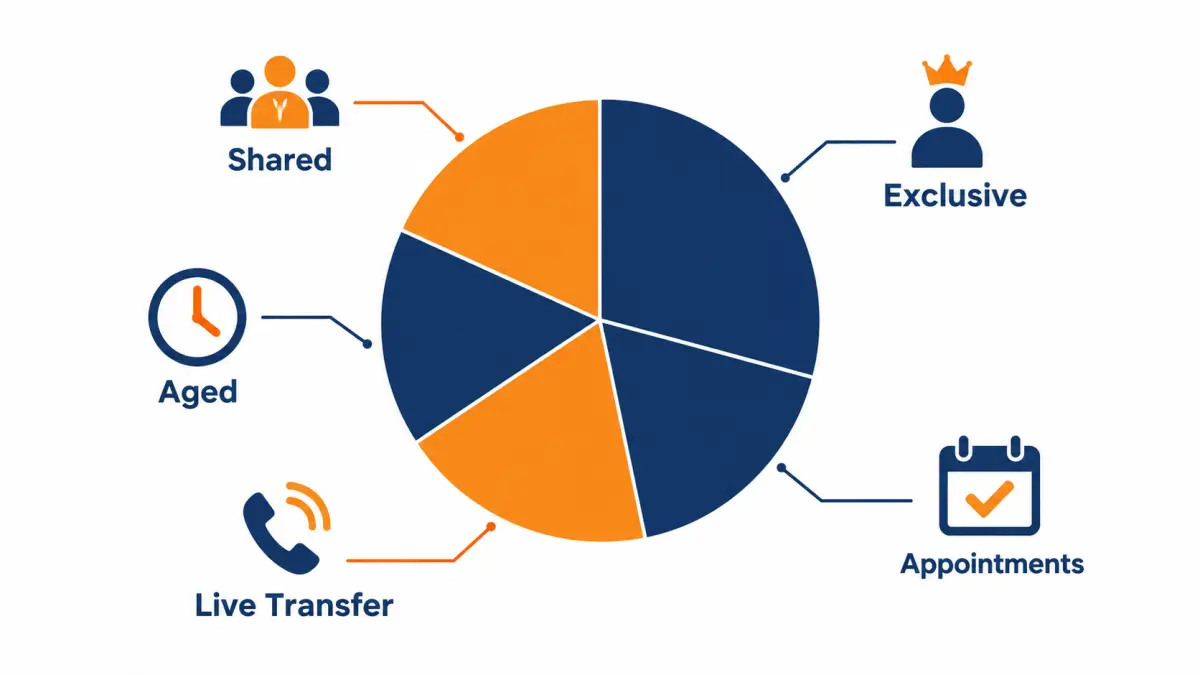
Each solar lead format comes with a different amount of work already done. Aged and shared leads are cheapest because you do most of the work yourself. Exclusive leads cost more because you have the homeowner to yourself. Live transfers and appointments cost the most because someone else has already reached the homeowner and qualified them.
Aged leads
Published range: $0.10 to $10+ (ActiveProspect, July 2026), with narrower bands of $0.60 to $1.50 for 30 to 85-day-old leads (Aged Lead Store via UpLead) and a wider $5 to $30 band from LeadGen Economy.
What you get: a name, phone, email, address and whatever answers the original form collected, usually from a homeowner who requested information weeks or months ago. Many will have bought already, lost interest, or forgotten the request.
Who it suits: teams with a dialer, a dedicated setter, and a nurture sequence that can work thousands of records cheaply. Aged leads also work as a training ground for new setters.
What to check: the age of the record, how many times it has been sold, and whether the consent language covers your company. A cheap lead with consent that named a different company is a compliance risk, not a bargain. Confirm with counsel. Availability of aged inventory for your territory is confirmed on the call.
Shared leads
Published range: $25 to $100 (ActiveProspect citing Enervio; UpLead), or $35 to $125 for leads sold to two or three buyers (LeadGen Economy).
What you get: a fresh lead that other installers also receive at the same moment. The homeowner can get several calls within minutes.
Who it suits: teams that can call within a minute or two and win on speed, and companies that sell on price.
What to check: the maximum number of buyers per lead, whether the buyer count is written into your agreement, and how the vendor handles returns. Our comparison of exclusive vs shared solar leads runs the break-even math.
Real-time leads
Published range: $40 to $120 (The Leads Warehouse, cited by ActiveProspect and UpLead).
"Real-time" describes delivery speed, not exclusivity. A real-time lead can be shared or exclusive. Many price lists use the term for the middle tier: fresh, delivered instantly, and sold to a small number of buyers. Always ask both questions: how fast, and to how many.
Exclusive leads
Published range: $100 to $250 (ActiveProspect citing Enervio; UpLead), $100 to $200+ (LeadGen Economy), $150 to $300 for exclusive high-intent web leads (SolarReviews).
What you get: one homeowner, delivered to you only. No other installer is calling them about that request.
Who it suits: small and mid-sized teams who cannot win a speed race against a call center, installers who sell on quality rather than lowest price, and markets with high job values.
What to check: how exclusivity is enforced, whether the lead is resold later as aged inventory, and what the replacement policy covers. Our replacement policy offers credits for disconnected numbers, wrong contact details, or leads outside your filters, reported within 7 days. It does not cover a prospect who isn't interested, doesn't answer, doesn't get financing approved, or doesn't buy. Read the full product page for residential solar leads for how filtering works.
Inbound calls and live transfers
Published range: $100 to $300+ (The Leads Warehouse, cited by ActiveProspect and UpLead).
What you get: a homeowner on the phone, either calling a tracked number or transferred live by a screening agent after answering qualifying questions. You skip the contact stage entirely, which is the stage where most purchased leads die. Prices are often set by call duration (a call counts once it lasts past a set number of seconds). Read the solar live transfer leads guide for how call buckets and billable durations work. Live transfer availability for your territory is confirmed on the call.
Booked appointments
Published range: $150 to $500 (ActiveProspect citing Enervio; UpLead), $150 to $200 (LeadGen Economy), $200 to $400+ for door-to-door appointments (The Leads Warehouse via ActiveProspect).
What you get: a date and time on your closer's calendar with a homeowner who has agreed to meet. You skip both the contact and the set stage. The open question is how many appointments actually sit. Our solar appointments program states its terms plainly: if a confirmed appointment doesn't sit because the prospect no-shows or doesn't match your filters, report it within 7 days of the scheduled time and we replace it.
| Format | Exclusive to you? | Contact still needed? | Appointment set still needed? | Best fit |
|---|---|---|---|---|
| Aged | Rarely | Yes, low contact rates | Yes | Dialer teams, nurture programs |
| Shared | No | Yes, against competitors | Yes | Speed-first call centers |
| Real-time | Depends on vendor | Yes | Yes | Ask how many buyers |
| Exclusive | Yes | Yes | Yes | Small and mid-size teams |
| Live transfer | Usually | No | Yes, on the call | Teams with closers on phones |
| Booked appointment | Usually | No | No | Closer-heavy teams, short setter bench |
What pricing models do solar lead vendors use?
Solar lead vendors use four main pricing models: a flat price per lead, a price per qualified call or appointment, pay-per-sale or revenue share, and monthly subscriptions or retainers. Per-lead pricing is the most common. Each model moves risk between you and the vendor, and the cheapest-looking model usually leaves the most risk with you.
Per lead
You pay a fixed price for every lead delivered that matches your filters. This is the simplest model to audit: count deliveries, subtract approved returns, multiply by price. The risk is entirely yours after delivery. If your team calls slowly, you pay the same. Per-lead pricing rewards installers who have strong speed-to-lead and a disciplined follow-up cadence.
Questions to ask:
- Which fields define a valid lead, and which defects qualify for a credit?
- How long is the return window?
- Is there a daily or monthly cap, and can you pause?
Per call or per appointment
You pay when a homeowner reaches your team by phone for longer than a billable threshold, or when an appointment is confirmed on your calendar. The vendor absorbs the contact and set stages, which is why the unit price is higher. The risk shifts to definitions: what counts as a billable call, what counts as a confirmed appointment, and what happens if the homeowner no-shows. Get those definitions in writing.
Pay per sale or revenue share
You pay only when a deal closes, either a fixed fee or a percentage of contract value. It sounds risk-free, and that is the catch. Vendors pricing on outcomes need high fees per sale to cover the deals that do not close, and they need visibility into your pipeline to bill you. Some installers find the fee per sale is higher than what they would pay buying leads and closing them well. Marketplace programs also exist where installers pay a fee per project won: UpLead reports installer-estimated fees of $1,000 to $2,000 per project for one large marketplace (October 2026), a figure we could not independently verify.
Subscription or retainer
You pay a monthly fee for a managed campaign, sometimes plus ad spend. The vendor runs ads in your name and passes you whatever comes in. This can work well when the vendor is good and the contract is short. It works badly when you cannot see the cost per lead inside the retainer. Insist on reporting that breaks spend into leads, appointments and sales.
| Model | You pay for | Who carries contact risk | Main thing to verify |
|---|---|---|---|
| Per lead | Each delivered lead | You | Return policy and lead definition |
| Per call / transfer | Calls over a billable duration | Vendor | Billable seconds and call screening questions |
| Per appointment | Confirmed appointments | Vendor | No-show and replacement terms |
| Pay per sale | Closed contracts | Vendor | Fee size vs your own cost per sale |
| Subscription | Monthly management | You | Transparent spend and lead counts |
Why does price per lead mislead installers?
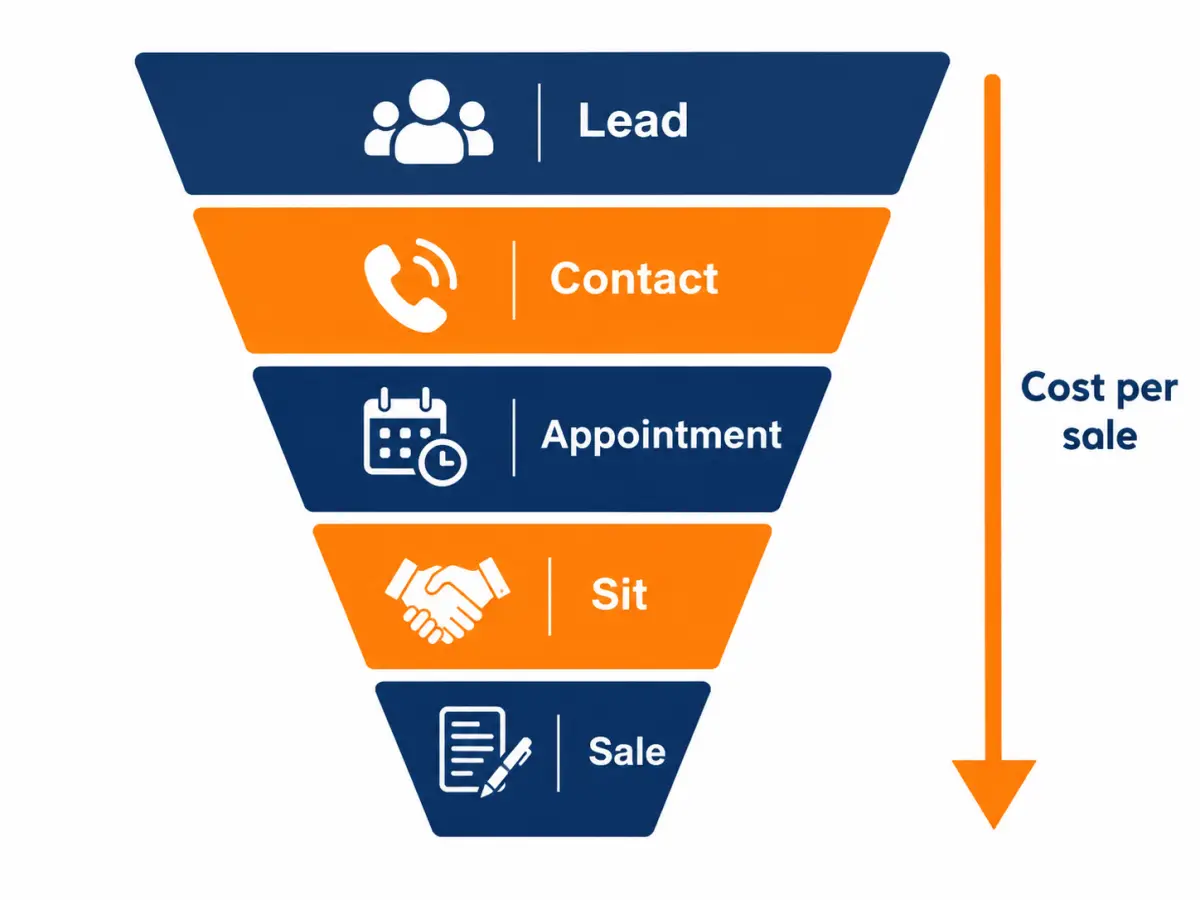
Price per lead misleads because a lead is the first step of a funnel, not a sale. Between the lead and the signed contract, you lose prospects at four stages: contact, appointment set, appointment sit, and close. The rate at each stage depends on the lead type and on your team, so two leads with different prices can produce the same cost per sale.
The four stages
- Contact rate: the share of leads your team actually speaks to. Speed and exclusivity drive this number more than anything.
- Appointment set rate: the share of contacted leads who agree to a consultation.
- Sit rate (show rate): the share of set appointments that actually happen with the decision makers present.
- Close rate: the share of sits that sign a contract that does not cancel.
Cost per sale is the lead price divided by the product of those four rates. That one formula is the core of our cost per sale math guide, which adds sensitivity tables and break-even rules.
Worked example: two lead types, same market
Illustrative example. The rates below are hypothetical inputs chosen to show the math, not benchmarks or results from any vendor, including us.
| Input | Shared lead | Exclusive lead |
|---|---|---|
| Price per lead | $50 | $150 |
| Contact rate | 45% | 70% |
| Appointment set rate (of contacts) | 25% | 40% |
| Sit rate | 60% | 75% |
| Close rate (of sits) | 20% | 25% |
| Lead-to-sale rate | 1.35% | 5.25% |
| Leads needed per sale | 74 | 19 |
| Cost per sale (leads only) | $3,704 | $2,857 |
The shared lead is a third of the price, yet in this example it costs about $850 more per sale. Change the inputs and the answer flips: if your team calls shared leads within 60 seconds and lifts the contact rate to 65%, the shared lead's cost per sale drops to about $2,564. That is the whole argument for testing with your own numbers. Plug your rates into the solar lead cost calculator and compare sources by the number that matters.
What the published close rates say, and why to be careful
Vendors publish lead-to-sale rates, and they are useful only as a sanity check. LeadGen Economy (April 2026) lists typical close rates of 8% to 15% for exclusive qualified leads, 3% to 5% for shared, 15% to 25% for set appointments and 1% to 3% for aged leads, and computes effective cost per acquisition bands of roughly $1,000 to $2,500. SolarReviews says its own leads close at 3% to 7% from lead to sale, with a 6% example in its ROI section. Those figures come from companies with a commercial interest, measure "close" differently, and are not portable to your team. Use them to spot a vendor promising something unrealistic, not to build a budget. UpLead's guide offers a blunt version of the same warning: a provider claiming 50% or higher conversion is likely misleading you.
Labor is part of the cost
Lead spend is not your whole acquisition cost. Setter wages, closer commissions, dialer seats, CRM licenses, and the manager's time all sit on top. An honest cost-per-sale calculation adds a labor cost per lead worked. Two leads with the same lead-only cost per sale can differ by hundreds of dollars once you count the hours spent dialing low-contact records.
Worked example: why the cheaper lead can cost more per install
Price per lead and cost per install can point in opposite directions, and a short calculation shows why. The figures below are an illustrative example, not market prices; replace them with your own quotes and close rates before making a decision.
Suppose Lead A costs P and Lead B costs 2.5P. Your team tracks each source separately and finds that Lead A converts to an installed system at 2% and Lead B at 6%.
- Cost per install, Lead A = P / 0.02 = 50P.
- Cost per install, Lead B = 2.5P / 0.06 = about 42P.
- Labour per install. Lead A needs 50 leads per install; Lead B needs about 17. If each lead takes 45 minutes of combined rep, setter and admin time, Lead A uses roughly 37 hours per install and Lead B roughly 13.
On these assumptions, the lead that costs two and a half times as much is cheaper per install before labour, and far cheaper after it. The reverse can also happen when a premium source underperforms, so the test has to be run, not assumed.
Use this checklist when you build the comparison:
- Count installs, not sales. Cancellations after signing are part of a source's true cost, so measure through to install or permission to operate where you can.
- Include credits. Subtract returned and replaced leads from spend so the price reflects what you actually paid.
- Separate sources fully. Mixing vendors in one CRM bucket hides which one performs.
- Match time windows. Compare leads bought in the same quarter and states, because seasonality and incentives shift conversion.
- Set a decision threshold. Agree in advance on the cost per install that justifies scaling a source, and on the sample size you need before acting.
Once you have your own rates, the solar lead cost calculator turns them into cost per install for any quote. Pricing for your territory is confirmed by ZIP on your call.
What does a lead cost from your own marketing?
Running your own Google or Meta ads produces leads at a cost set by click prices, landing page conversion and your management time. No current public source we could verify gives a solar-specific per-lead range for self-run ads, so model it with your own click and conversion data. UpLead notes competitive solar keywords can exceed $20 per click (October 2026).
How the in-house math works
Illustrative example. Suppose you pay $15 per click and your landing page converts 8% of visitors into a form fill. Your cost per lead is $15 / 0.08 = $187.50 before any filtering. If 20% of those forms are renters, out-of-area or duplicates, your cost per usable lead is $234. Those inputs are hypothetical, but the structure is the same for every campaign: cost per click divided by conversion rate, then divided by the share that is usable.
What in-house cost per lead leaves out
The ad platform report shows media spend only. It leaves out:
- Agency or freelancer fees, or your own hours managing campaigns
- Landing page software, call tracking, and form tools
- Creative production (photos, video, copy)
- The consent capture and record keeping you now own as the lead generator
- The learning period, during which cost per lead is often well above the eventual steady state
In-house leads have real advantages. They are exclusive by definition, they carry your brand, and you control the consent language. Most installers end up running some paid media in-house and buying from vendors to fill gaps in volume or territory. The useful comparison is fully loaded cost per sale from each source, tracked in the same CRM.
How does solar lead cost vary by state?
Solar lead prices vary by state because electricity rates, incentives, sun hours and installer competition differ. California, Hawaii, Massachusetts and New York are consistently among the most expensive markets, and the Dakotas and much of the Midwest among the cheapest, according to SolarReviews and LeadGen Economy data published in 2025 and 2026.
LeadGen Economy (updated April 2026) lists per-lead ranges of $175 to $300+ for California and $15 to $35 for North Dakota. A SolarReviews table that is widely quoted as "California $1,929, North Dakota $225" actually measures lead cost per sale for multi-installer leads, not price per lead. Mixing those two measures is the most common error we found across competitor pages. The full state-level comparison, with both tables and the factors behind them, lives in our solar lead prices by market guide.
How has the end of the 25D credit affected lead prices?
The residential clean energy credit under Section 25D ended for systems placed in service after December 31, 2025, according to the IRS. Cash and loan buyers lost a 30% credit, which lowers close rates on those deals and raises the cost per sale of any lead you buy, even if the lead price stays the same.
Why price per lead may not fall
You might expect lead prices to drop when demand softens. Some shared and aged inventory may get cheaper. But lead vendors buy clicks in the same auctions as installers, and those auctions do not reset because a tax credit expired. If fewer homeowners convert on each landing page, the vendor's cost to produce a lead rises. In practice, installers report the same or higher prices paired with lower close rates, which is the worst combination for cost per sale. We could not find a public, dated dataset that measures 2026 lead price changes directly, so treat this as reasoning, not a statistic.
Where demand shifts
Third-party ownership (leases and power purchase agreements) can still benefit from business credits that remain in effect for qualifying projects, subject to deadlines and rules that change. That pushes more of the market toward TPO offers, which changes what a lead is worth to you if you do not sell TPO. Talk to your tax advisor about specific projects. Our guide to the post-25D solar market covers the shift in more depth.
What to watch next quarter
- Your own close rate on cash and loan deals compared with the same quarter in 2025
- The share of your sales that are TPO
- Return and replacement requests from each vendor, a leading indicator of lead quality slipping
- Click prices in your own ad accounts, which signal what vendors are paying
- Battery attach rates, which raise job value and can absorb higher acquisition costs
How should an installer budget for lead spend?
Budget lead spend backward from installs. Pick a monthly install target, estimate leads needed per sale from your own funnel rates, multiply by price per lead, then check the result against your gross margin per job. If lead cost per sale eats more than the share of margin you can give to acquisition, change the lead type, the market, or the funnel.
The per-install budget method
- Set the target. For example, 8 additional installs per month from purchased leads.
- Estimate your lead-to-sale rate. Use your own last 90 days if you have them. If you do not, run a test batch before committing a full budget.
- Compute leads needed. Installs divided by lead-to-sale rate. At an illustrative 4% lead-to-sale rate, 8 installs need 200 leads.
- Compute lead spend. Leads times price. At an illustrative $120 per lead, that is $24,000, or $3,000 per sale.
- Check the margin. Compare $3,000 per sale with the gross margin per job after equipment, labor, permitting and sales commission. If $3,000 is more than you can afford, the plan fails before it starts.
- Add labor. Estimate setter hours to work 200 leads and add the cost.
- Set kill criteria. Decide before you buy at what cost per appointment you will stop or switch.
Sizing a pilot
A pilot needs enough leads to produce a readable number of appointments, not sales. Sales take weeks to close, and a handful of sales is too noisy to judge. A practical rule is to size the pilot so it produces at least 15 to 25 appointments, then judge on cost per appointment and sit rate while the sales cycle catches up. Illustrative example: if you expect 1 in 5 leads to set an appointment, a pilot of 100 to 125 leads gets you there.
| Lead-to-sale rate | Leads needed | Lead spend | Lead cost per sale |
|---|---|---|---|
| 2% | 400 | $48,000 | $6,000 |
| 3% | 267 | $32,040 | $4,005 |
| 4% | 200 | $24,000 | $3,000 |
| 6% | 134 | $16,080 | $2,010 |
| 8% | 100 | $12,000 | $1,500 |
The table shows why improving the funnel is often worth more than negotiating price. Moving from 3% to 6% lead-to-sale cuts lead cost per sale in half. Negotiating a 10% discount on price saves $400 per sale at the 3% rate.
Budget mistakes we see
- Buying more leads per day than the team can call within five minutes.
- Judging a vendor on the first week, before leads have had time to set and sit.
- Comparing an appointment price with a lead price as if they were the same unit.
- Ignoring returns: a vendor with a lower price and no credits for bad data can cost more.
- Spreading a small budget across five vendors so no source produces a readable result.
When you are ready to price a test batch for your ZIP codes, book a call. Pricing is confirmed by ZIP on your call, and territory availability is confirmed by ZIP code on the same call.
How do you convert a lead price into cost per contact, appointment and sale?
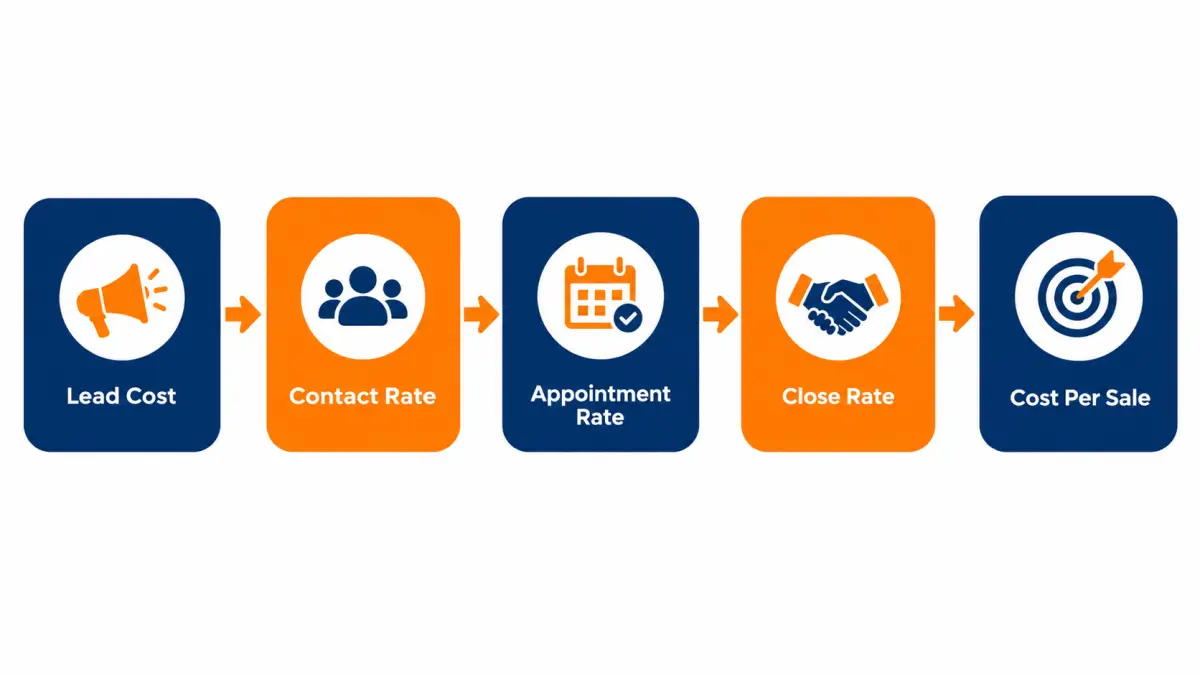
To compare solar lead prices fairly, convert every quote into the same unit. Divide price per lead by your contact rate to get cost per contact, by contact times set rate to get cost per appointment, and by the full funnel to get cost per sale. Only then can a $40 lead, a $200 transfer and a $350 appointment be compared.
Most arguments about whether solar leads are "expensive" come from people comparing different units. One installer says leads cost $45. Another says they cost $300. Both may be right, because the first is talking about a shared web form and the second about a booked appointment. The fix is a conversion ladder that you apply to every quote before you look at the headline number.
The conversion ladder
Write these five lines at the top of every vendor comparison sheet:
- Cost per lead = what the vendor invoices, divided by leads delivered, after approved returns.
- Cost per contact = cost per lead divided by contact rate.
- Cost per set appointment = cost per contact divided by appointment set rate.
- Cost per sat appointment = cost per set appointment divided by sit rate.
- Cost per sale = cost per sat appointment divided by close rate.
Every product on the market enters this ladder at a different rung. A shared or exclusive web lead enters at rung 1. An inbound call or live transfer enters at rung 2, because the vendor has already produced the conversation. A booked appointment enters at rung 3. If you price an appointment against a web lead without walking the web lead up to rung 3, you are comparing a finished product with raw material.
Worked conversion: one budget, three products
Illustrative example. All rates and prices below are hypothetical inputs chosen to show the arithmetic. They are not benchmarks, quotes or results from any vendor, including us.
Suppose you have three quotes on your desk for the same ZIP codes: an exclusive web lead at $150, a live transfer at $220, and a booked appointment at $350. Your own historical rates for each are in the table.
| Step | Exclusive web lead | Live transfer | Booked appointment |
|---|---|---|---|
| Unit price | $150 | $220 | $350 |
| Contact rate | 65% | 100% (already on the phone) | n/a |
| Cost per contact | $231 | $220 | n/a |
| Appointment set rate | 35% | 45% | 100% (already set) |
| Cost per set appointment | $659 | $489 | $350 |
| Sit rate | 70% | 70% | 65% |
| Cost per sat appointment | $941 | $698 | $538 |
| Close rate (of sits) | 25% | 25% | 22% |
| Cost per sale (product only) | $3,766 | $2,794 | $2,448 |
In this made-up case the most expensive unit is the cheapest per sale. Change one input and the order can flip. If the appointment vendor's sit rate is really 40% instead of 65%, the appointment's cost per sale rises to about $3,977, worse than the web lead. That is why sit rate is the single most important number to verify before you buy appointments, and contact rate is the most important number before you buy web leads.
Add labor before you decide
Product cost per sale ignores the people who work the leads. A web lead needs a setter to dial it, often many times. A live transfer needs a closer or senior setter free the moment the call arrives. A booked appointment needs only a confirmation call and a closer's time at the sit.
Illustrative example, continued. Suppose your setter costs $25 per hour fully loaded and spends an average of 20 minutes of dialing and texting per web lead across the full cadence. That adds about $8.33 per lead, which becomes about $209 per sale at the web lead's 4% lead-to-sale rate. Suppose a live transfer ties up 15 minutes of a $40-per-hour closer per call, or $10 per transfer, which adds about $127 per sale. The appointment needs a 5-minute confirmation call, about $2 per appointment, or about $14 per sale. The labor gap narrows the difference but, in this example, does not reverse it.
Run the same labor line for your own team. If you pay setters per appointment rather than per hour, use that number. The point is to make the comparison complete, not to prove a particular product is best.
When a cheap unit really is cheaper
Aged and shared leads win the conversion test when your team is unusually good at the stage the vendor skipped. A call center with a predictive dialer, a 30-second response time and a strong text cadence can push shared contact rates high enough that the low unit price carries through to the bottom of the ladder. A small team with one part-time setter usually cannot. The ladder does not care which product is fashionable. It only reflects what your team does with each lead. For the full sensitivity math, see our solar lead ROI guide.
What does solar lead spend look like by installer size?
Lead spend scales with install targets, not company size, but the right product mix changes with team structure. Owner-operators usually do best with small volumes of exclusive leads or appointments. Mid-size teams with dedicated setters can blend in shared and aged leads. Large call-center operations can work cheap high-volume inventory that would bury a small team.
The scenarios below are built from the published ranges in the price table above and hypothetical funnel rates. They show how the same market prices land differently on different teams. None of them describe a real customer, and none use our prices.

Scenario A: owner-operator, one crew, owner sells
Illustrative example. A two-person crew where the owner runs sales in the evenings and installs during the day. Target: 3 extra residential jobs a month from purchased leads.
The constraint here is time, not money. The owner can call leads at lunch and after 5 p.m. That means contact speed is poor for anything shared. In this setup, a shared lead at the low end of the published $25 to $100 range (ActiveProspect, July 2026) may produce almost no contacts, because the homeowner has already spoken with two faster companies before the owner picks up the phone.
| Option | Assumed unit price | Assumed unit-to-sale rate | Units needed | Monthly spend |
|---|---|---|---|---|
| Shared leads, slow follow-up | $50 | 0.8% | 375 | $18,750 |
| Exclusive leads | $160 | 4% | 75 | $12,000 |
| Booked appointments | $300 | 15% | 20 | $6,000 |
The appointment option looks cheapest here because it removes the stages the owner cannot staff. It also uses the fewest hours: 20 kitchen-table meetings a month is a full load for someone who is also on roofs. The risk is concentrated in sit rate and appointment definition, so the owner should read the vendor's no-show terms before anything else. Our solar appointments page explains how confirmed appointments are defined and replaced.
Scenario B: regional installer, 4 reps and 1 setter
Illustrative example. Four commission closers and one hourly setter. Target: 12 sales a month from purchased leads on top of referrals.
This team has one person whose job is to call leads fast during business hours. It can handle a steady flow of exclusive web leads and a smaller share of shared leads during the setter's shift. It cannot take hundreds of aged leads a week without starving the fresh ones.
| Bucket | Assumed unit price | Units | Spend | Assumed sales |
|---|---|---|---|---|
| Exclusive web leads | $150 | 200 | $30,000 | 8 |
| Shared leads (setter hours only) | $45 | 150 | $6,750 | 2 |
| Aged leads (slow days) | $2 | 1,000 | $2,000 | 2 |
| Total | $38,750 | 12 |
Blended lead cost per sale in this example is about $3,229. The aged bucket looks wonderful on paper at $1,000 per sale, but that assumes a 0.2% lead-to-sale rate the team has not proven yet. The right move is to run aged leads as a separate measured test, not as a line item that quietly props up the blended number.
Scenario C: multi-crew installer with an inside sales floor
Illustrative example. Ten closers, six setters on a power dialer, a sales manager who watches dashboards daily. Target: 40 sales a month from purchased sources.
At this size, the operation can call within a minute during staffed hours and can work aged inventory systematically. It can also absorb live transfers, because someone is always free to pick up. The constraint becomes territory supply: there may not be enough exclusive inventory in the target ZIP codes at any price.

A team like this typically spreads spend across four or five products and manages each as its own P&L line. The useful discipline is weekly review of cost per sat appointment by source, with a written threshold for pausing a source. Large teams lose money by letting a bad source run for a month because nobody owned the number.
Scenario D: new market entry
Illustrative example. An established installer opening a new state with no referral base and no brand recognition. Target: 6 sales in the first full month, mostly to prove the market.
New-market entry is the one case where paying more per sale can be rational. The first installs create reviews, photos, permit experience and referral seeds. Many installers buy appointments or transfers here, accept a higher cost per sale for the first 60 to 90 days, and shift toward web leads once a local setter is hired and the funnel rates are known. Budget for it as a launch cost with an end date, not as a permanent rate. State-level price differences are covered in our solar lead cost by state guide.
What changes with size, and what does not
| Team type | Main constraint | Products that usually fit | Products to test carefully |
|---|---|---|---|
| Owner-operator | Owner's hours | Appointments, small exclusive batches | Shared, aged |
| Small team with setter | Setter capacity | Exclusive, some live transfers | High-volume aged |
| Mid-size sales floor | Lead supply in territory | Exclusive, shared, transfers | Pay-per-sale with opaque billing |
| Large call center | Management attention | All, including aged at scale | Anything without source-level reporting |
| New market entry | No local funnel data | Appointments, transfers | Long contracts, big minimums |
What does not change: every team should judge every source on cost per sale, measured in its own CRM, over enough volume to be readable.
How much do commercial solar leads cost?
We could not find a dated public price range for commercial solar leads that defines the product clearly, as of October 2026. The vendor guides cited in this article focus on residential leads. Commercial lead prices are usually quoted per project, and the value of each lead is far higher because commercial systems are larger and sales cycles longer.
That absence is itself useful information. If a vendor quotes you a commercial lead price, you have nothing public to benchmark it against, so the only defensible test is your own funnel. Ask for a clear definition before you ask for a price.

What a commercial lead should contain
A residential lead is a homeowner who filled out a form. A commercial lead is a business, and the quality depends on whether the person in the record can make or influence the decision. Before you discuss price, agree in writing on:
- Decision role. Owner, CFO, facilities manager, or someone else? A receptionist who filled out a form is not a decision maker.
- Property control. Does the business own the building, or lease it? Tenants often cannot authorize a rooftop system without the landlord.
- Site type. Roof, carport, ground mount. Roof age and structure matter.
- Usage data. Approximate annual electricity spend or a willingness to share bills.
- Timeline and budget path. Capital purchase, loan, lease or PPA.
How the economics differ from residential
Illustrative example. A commercial installer wins 1 project out of every 25 qualified leads, and the average project carries a gross margin far larger than a residential job. Even a lead price several times higher than residential can work at those numbers. The flip side is time: a commercial deal may take months from first call to signature, so a pilot cannot be judged on sales in the first quarter. Judge it on site visits booked and proposals requested.
Read the commercial solar leads guide for qualification questions and product definitions. Commercial availability for your territory is confirmed on the call.
Pricing models you will see for commercial
- Per qualified lead, with a strict definition of decision role and property control.
- Per meeting or site visit, where the vendor books the decision maker.
- Retainer plus per-meeting fee, common with outbound appointment-setting firms.
- Success fee, sometimes a percentage of contract value. Read billing triggers closely, because commercial contracts can be amended, phased or cancelled before installation.
Whatever the model, insist on reporting by account, not just by lead, so you can see which businesses were actually reached.
What hidden costs sit on top of the lead price?
The invoice is only part of what a solar lead costs. Setter and closer time, dialer and CRM seats, texting and call tracking fees, returns you never claimed, consent record handling, and management hours all add to acquisition cost. A fully loaded cost per sale can run well above the lead-only number, so budget both.
The useful habit is to put every cost on one sheet next to the lead invoice. Most installers already know their lead bill to the dollar. Far fewer know what it costs them in labor and software to turn that bill into signed contracts.

Line-item checklist
Use this list to build a fully loaded monthly acquisition budget. Fill in your own numbers. We have not put dollar figures on it because software and wage costs vary too much to give a fair default.
People
- Setter wages or per-appointment pay, including payroll taxes and benefits
- Closer commissions and any per-sit bonuses
- Sales manager time spent on lead review, coaching and vendor calls
- Owner time spent negotiating, disputing returns and reading reports
Software and telecom
- CRM seats
- Dialer seats, including per-minute charges
- SMS platform fees and carrier registration costs
- Call recording and call tracking numbers
- Lead distribution or routing tool, if you use one
- Calendar and reminder tools for appointment confirmation
Compliance and records
- Storage of consent certificates and call recordings for your retention period
- Do Not Call list access and internal DNC management
- Time spent responding to consumer complaints or data requests
- Legal review of vendor agreements (confirm with counsel what you need)
Waste
- Leads that qualified for a credit but were never returned
- Leads delivered outside staffed hours that went cold
- Duplicate leads bought from two vendors for the same homeowner
- Appointments that did not sit and were not reported in time
Illustrative fully loaded calculation
Illustrative example. Hypothetical inputs only. A team spends $20,000 a month on exclusive leads and closes 8 sales from them, or $2,500 lead cost per sale. It also pays a setter $4,000 a month fully loaded, spends $900 on dialer, CRM and SMS seats, and estimates 10 hours of manager time at $50 per hour, or $500. Total acquisition cost is $25,400, or $3,175 per sale. The lead-only number understated the real cost by $675 per sale, about 27%.
Now apply the same overhead to a cheaper source. If the same team switched to shared leads at a lower lead-only cost per sale but needed a second setter to keep up, the extra $4,000 a month in labor would add $500 per sale at 8 sales. A source that looks $400 cheaper per sale on the invoice can be $100 more expensive when labor is included.
The waste line is usually the easiest win
Most teams cannot cut setter wages or software seats without hurting the funnel. They can almost always cut waste. Three habits recover money quickly:
- Return every qualifying lead within the window. Assign one person to check bad numbers and out-of-filter leads daily. Under our terms, credits cover disconnected numbers, wrong contact details, or leads outside your filters, reported within 7 days. A missed window is money you already paid for nothing.
- Match delivery hours to staffed hours. If nobody calls after 7 p.m., ask the vendor to pause delivery or route late leads to a morning queue that gets called first.
- De-duplicate across vendors. If you buy from two sources, check new leads against your CRM before dialing. The same homeowner bought twice is a pure loss.
How do returns and credits change the real price of a lead?
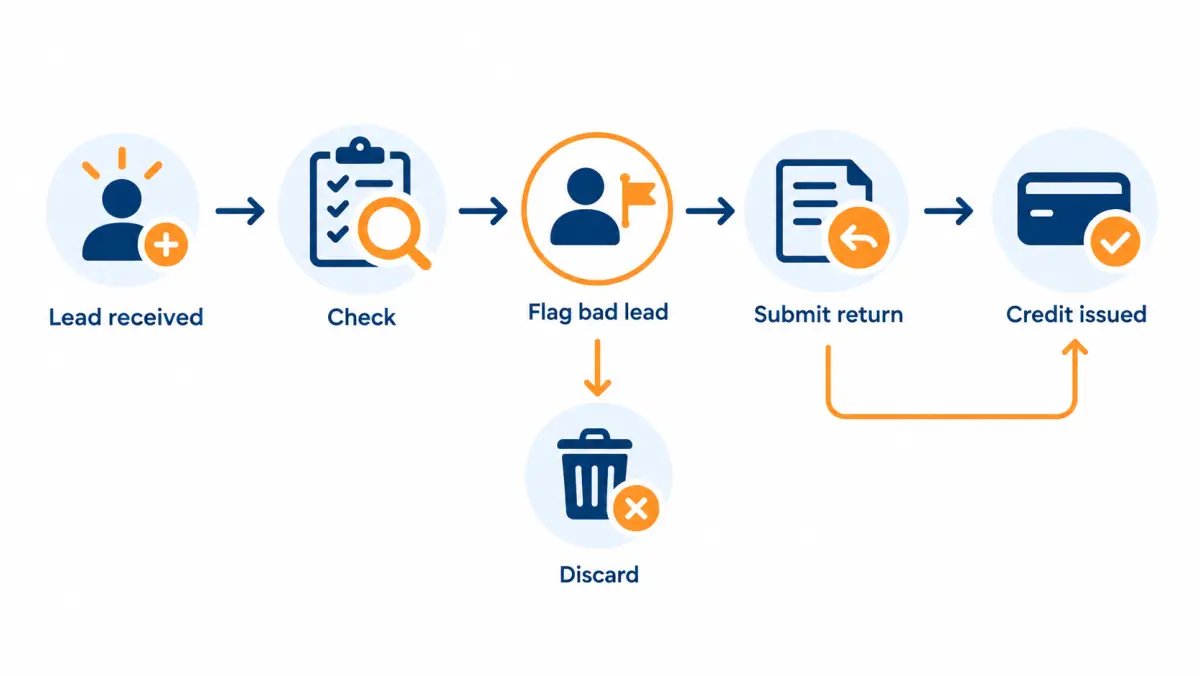
A vendor's replacement policy changes the effective price of every lead. If 10% of leads qualify for credit and you claim them all, your effective cost per usable lead is the same as the sticker price. If you claim none, your cost per usable lead rises by about 11%. Compare policies by what they cover, the window, and how credits are paid.
Two vendors can quote the same price and deliver very different value because their return policies differ. One may credit any disconnected number for 14 days. Another may accept returns only for leads outside the agreed ZIP codes, within 48 hours, as credit toward future purchases. The second is effectively more expensive.
The effective price formula
Illustrative example. Effective price per usable lead = (leads bought x price − credits received) / usable leads.
| Situation | Invoice | Credits received | Usable leads | Cost per usable lead |
|---|---|---|---|---|
| All 12 defects claimed and approved | $15,000 | $1,800 | 88 | $150.00 |
| Half claimed in time | $15,000 | $900 | 88 | $160.23 |
| None claimed | $15,000 | $0 | 88 | $170.45 |
The gap between the first and last rows is a 13.6% price increase that came entirely from process, not from the vendor.
What replacement policies usually cover and exclude
Replacement terms are where vendor price sheets hide the most variation. Read for three things.
Covered defects. Data problems the vendor controls: disconnected or invalid phone numbers, wrong contact details, duplicates of a lead already sold to you, and leads outside your agreed filters such as ZIP code or homeownership.
Excluded outcomes. Sales outcomes the vendor does not control. Our own policy states them plainly: not covered is a prospect who isn't interested, doesn't answer, doesn't get financing approved, or doesn't buy. Most honest vendors exclude the same things, because a vendor that credited every lost sale would have to price leads far higher to stay in business. Be skeptical of a vendor that promises to credit "bad leads" without defining bad.
Mechanics. How you submit (portal, email, reply to notification), the window, whether credits are cash refunds or credits against future batches, and whether there is a cap on return percentage. Our process is to reply to the lead notification or email us with the reason, and approved credits apply to your next batch.
Return policy comparison worksheet
Copy this table into your vendor review and fill it in from each written agreement, not from a sales call.
| Question | Vendor 1 | Vendor 2 | Vendor 3 |
|---|---|---|---|
| Which defects are covered? | |||
| Which outcomes are excluded? | |||
| Return window (days) | |||
| How to submit | |||
| Credit form (refund, credit, replacement lead) | |||
| Cap on returns as % of volume | |||
| Evidence required (call recording, screenshot) | |||
| Average time to approve |
Do not abuse returns
Returns work when both sides treat them honestly. If your team returns leads that were valid but did not buy, a good vendor will notice, stop approving, or drop you. Return what the policy covers, document it, and keep a running return rate by vendor. A sudden spike in legitimate returns is one of the best early warnings that a vendor's traffic has changed.
How do you read a solar lead vendor's price sheet?
Read a solar lead price sheet by finding the definitions before the numbers. For each price, confirm how many buyers receive the lead, how old it can be at delivery, which filters are included, what counts as a valid lead, the return window, minimums, and delivery caps. A price with missing definitions cannot be compared with any other.
Price sheets range from a single line ("Exclusive solar leads: $X") to multi-page rate cards with surcharges by state, filter and time of day. The longer ones are often easier to evaluate, because they tell you what you are paying for.
The fifteen definitions to pin down
- Buyer count. Exclusive (one buyer), or shared to how many maximum?
- Delivery speed. Seconds, minutes, or batched?
- Maximum age at delivery. Is a "fresh" lead guaranteed under a certain number of minutes old?
- Source. Search ads, social ads, content sites, call centers, or a mix? Can you see source by lead?
- Form questions. What did the homeowner answer? Get a copy of the actual form.
- Filters included in price. Homeownership, minimum bill, property type, credit band, shade, roof age.
- Filters that cost extra. Many vendors charge more for each additional filter.
- Geography. By ZIP, county, radius or state? What happens when a lead falls just outside?
- Consent. Is there a timestamped consent record, and does the disclosure name your company? Every lead we deliver carries a timestamped consent record (certificate) whose disclosure names your company, and we send it on request. See our TCPA compliance guide for what to check, and confirm with counsel.
- Validation. What checks happen before delivery? Phone validation, DNC scrub, duplicate check, property records?
- Returns. Covered defects, window, mechanics.
- Minimum order. Test batch available? Monthly minimum?
- Caps and pacing. Daily caps, hourly pacing, weekday-only delivery.
- Contract term. Month to month, or locked in? Notice period to pause?
- Payment terms. Prepaid, card on file, invoiced? Do unused prepaid balances expire?
Red flags on a price sheet
- A price with no buyer count stated.
- "Exclusive" with no statement that the lead will not be resold later.
- No mention of consent records.
- Returns described only as "case by case."
- A conversion rate promised on the sheet. UpLead's guide says a provider claiming 50% or higher conversion is likely misleading you, and we agree that any promised close rate deserves a hard look.
- Prepaid packages with no refund of unused balance.
For a full checklist of vendor due diligence beyond pricing, use our guide on how to vet a solar lead provider.
Translating surcharges into a single number
Some vendors build price from a base plus add-ons: a base lead price, a surcharge per filter, a premium for certain states, and a discount for volume. Collapse these into one all-in price per lead for your exact configuration before you compare.
Illustrative example. Base price $90, plus $10 for a minimum-bill filter, plus $15 for a credit filter, plus a 20% premium for your state, minus a 5% volume discount. All-in: ($90 + $10 + $15) x 1.20 x 0.95 = $131.10. That is the number that goes into your conversion ladder, not the $90 base.
How do you negotiate a better price on solar leads?
You negotiate solar lead prices by trading something the vendor values for a lower price or better terms. Vendors value predictable volume, flexible geography, fast payment, and low return rates. Ask for a test batch first, then negotiate on evidence: your contact and set rates on their leads, and the volume you can commit to if numbers hold.
Negotiation works best after a pilot, not before. Before a pilot, you have nothing to offer except a promise. After a pilot, you have data, and the vendor has seen that you work leads properly.
What vendors will usually trade
| What you offer | What you can ask for | Watch out for |
|---|---|---|
| Higher committed monthly volume | Lower unit price | Minimums you cannot work |
| Wider geography | Lower price or more volume | Leads too far for your crews |
| Fewer filters | Lower price | Paying setters to filter instead |
| Prepayment | Discount | Unused balance that never refunds |
| Longer delivery hours | More volume at same price | Leads arriving when nobody calls |
| Low return rate history | Better terms, priority inventory | None, if returns were honest |
Scripts you can adapt
These are plain-language starting points. Adjust them to your situation and your relationship with the vendor.
Asking for a test batch
"Before we commit to monthly volume, we'd like a test batch in our core ZIP codes. We'll track contact rate, set rate and sit rate by lead, and share those numbers with you at the end. If the test works, we'll talk about volume. What's the smallest batch you can do, and what's the price for that batch?"
Asking for the definition before the price
"Before we talk price, can you send me the actual form your homeowners fill out, the consent language, and your return policy in writing? I want to compare apples to apples."
Negotiating after a good pilot
"Your leads set appointments at a rate we're happy with. We'd like to double volume next month. What price can you do at that volume, and can you hold it for 90 days so we can plan crews?"
Negotiating after a mixed pilot
"Contact rate on your leads was fine but set rate was low, and when we listened to calls, a lot of homeowners didn't remember asking about solar. Can you show me which traffic sources those leads came from? We'd like to keep buying from the sources that worked and drop the rest."
Pushing back on a minimum
"We can't work 300 leads a month without hiring, and we won't hire until we've proven the source. Can we start at 100 for two months, with a written price step-down if we move to 300?"
What not to negotiate away
Do not trade consent quality, exclusivity definitions, or return windows for a lower price. A $20 discount per lead is worth nothing if the consent record does not name your company or if the "exclusive" lead shows up in an aged lead batch next quarter. Our terms on that point do not move: each exclusive lead is sold to one company and is never resold, recycled or sold later as an aged lead.
How does your sales model change what you can pay per lead?
Your sales model sets how many leads each closer can work and how much each sit costs you in time, so it changes the lead price you can afford. Virtual closers can run more consultations per day than field closers, which lowers labor per sale. Field teams pay more per sit in drive time but may close more. Dealers who sell for an EPC have a different margin entirely.
Two installers buying the same lead at the same price can have very different results because they sell differently. Before you decide a lead is too expensive, check whether your sales model is the real constraint.
In-home (field) consultations
A closer drives to the home, inspects the roof and meets the homeowners in person. Each sit takes a large block of time including travel. That makes every no-show expensive, because the closer's afternoon is gone. Field teams should weight sit rate heavily when comparing sources and invest in confirmation.
Illustrative example. If a field closer can run three sits a day and a no-show wastes a slot, a source with a 50% sit rate burns 1.5 slots a day per closer. Moving to a source with a 70% sit rate at a higher price might still lower cost per sale, because closer time is the binding constraint.
Virtual consultations
The closer presents over video with satellite imagery and a shared proposal. More consultations fit in a day and no-shows cost less time. Virtual teams can usually tolerate a lower sit rate and a cheaper lead, as long as contact and set rates hold. They also pair well with live transfers, because the closer can sometimes move straight into a consultation.
Hybrid
Many teams run a virtual first meeting and an in-home second visit for engaged homeowners. Track sits for each meeting type separately. A source that produces many first meetings but few second visits may be bringing curious homeowners rather than buyers.
Dealers and sales organizations
A dealer sells under an EPC or financing partner and earns a commission or margin per watt, while the partner installs. The dealer's lead budget comes out of that margin. Dealers should compute their ceiling from their own commission per job, not the full job margin, which is usually a smaller number. That makes cheap, high-volume products tempting for dealers, but the conversion ladder still applies.
Door-to-door teams buying appointments
Some field organizations buy door-to-door appointments, reported at $200 to $400+ by The Leads Warehouse via ActiveProspect (July 2026). These are set by canvassers in person. Ask how the appointment was set, how long after the knock the meeting is scheduled, and whether both decision makers agreed to attend.
| Sales model | Binding constraint | Metric to weight most | Products that often fit |
|---|---|---|---|
| Field (in-home) | Closer hours and travel | Sit rate | Exclusive leads, confirmed appointments |
| Virtual | Contact and set volume | Contact and set rate | Exclusive, shared at speed, live transfers |
| Hybrid | Second-meeting conversion | First-to-second meeting rate | Exclusive, transfers |
| Dealer | Commission per job | Cost per sale vs commission | Depends on partner terms |
| Door-to-door | Canvasser coverage | Sit and close rates | Door-knock appointments, aged leads for callbacks |
How do filters and targeting change what you pay?
Every filter you add to a solar lead order narrows the pool of homeowners who qualify, which usually raises the price per lead and lowers volume. Filters are worth paying for when they remove leads you would never sell. They are a waste when they screen out buyers you could have closed, or when they duplicate qualification your setter already does.
The filter question is a trade between the vendor's work and your team's work. Each qualifying question the homeowner answers on the form is a question your setter does not have to ask, and a lead you do not have to pay for if the answer is wrong. But each question also lowers the number of people who finish the form, so the vendor must spend more on traffic to produce each lead.
Common filters and what they screen out
| Filter | What it removes | Usually worth it when | Maybe not worth it when |
|---|---|---|---|
| Homeownership | Renters | Almost always for residential | Rarely skip it |
| Property type | Condos, mobile homes, multi-family | You only install on single-family roofs | You offer ground mounts or carports |
| Minimum monthly bill | Low-usage homes | Small systems do not pay your margins | You sell batteries or backup to low-usage homes |
| Credit band (self-reported) | Low credit prospects | You sell mostly loans | You sell TPO with different approval rules, or cash |
| Roof shade | Heavily shaded roofs | Your designs cannot work around shade | You can quote ground mounts |
| Timeline | "Just researching" | Your team cannot nurture | You have a strong long-term nurture |
| Utility | Homes in utilities with poor export terms | Economics differ sharply by utility | You sell storage-first |
| ZIP or radius | Homes too far from your crews | Always, to match install range | Never skip it |
How to test whether a filter pays
Illustrative example. You currently buy exclusive leads without a credit filter at $140. A vendor offers the same leads with a credit filter at $165. In your CRM, 30% of your unfiltered leads that reach the proposal stage fail financing. If the filter removed most of those, your close rate on sits would rise. Run the ladder twice, once with each price and the close rate you would expect, and see which gives the lower cost per sale. If you do not have enough history to estimate the change, buy a small batch of each and compare.
The same test works for any filter. The question is always: does the higher price buy a big enough rise in a downstream rate?
Self-reported versus verified
Most filters are self-reported by the homeowner. Some vendors verify a subset, such as homeownership against property records or phone numbers against carrier data. Our quality checks are specific and we keep the list literally true: phone number validated before delivery, homeowner status self-reported then checked against property records, duplicate-checked against leads already sent to you, and scrubbed against the National Do Not Call Registry. Ask every vendor for the same kind of list, in writing, and which items are verified rather than self-reported.
How much do live transfers and inbound calls really cost?
Live transfer and inbound call prices, reported at $100 to $300+ by The Leads Warehouse via ActiveProspect (July 2026), depend on how a billable call is defined. Most vendors charge once a call passes a set number of seconds. Your real cost is the price divided by the share of billable calls that turn into qualified conversations.

The billable-duration trap
A billable threshold is the number of seconds a call must last before you pay. A short threshold means you pay for calls that were never real conversations: a homeowner who hangs up after hearing a sales greeting, a wrong number that takes a while to sort out, a call that drops. A longer threshold protects you but usually comes with a higher unit price.
Illustrative example. You buy 50 transfers at $200 each, all past the billable threshold. Your closer marks 35 as qualified conversations (right homeowner, owns the home, in your area, open to a quote). Your cost per qualified conversation is $10,000 / 35 = $286, not $200. Of those 35, 14 set an appointment, so each set costs about $714. Those numbers then go into the ladder.
Questions to ask about transfers
- What is the billable threshold in seconds, and when does the clock start?
- What questions did the screener ask before transferring?
- Is the homeowner told they are being transferred to a solar company, and is that company named?
- Are calls recorded on both legs, and can you get the recording for disputes?
- What happens if no one at your company answers within a set number of rings?
- Can you set transfer hours and a maximum number of concurrent transfers?
The last question matters more than it looks. A transfer that rings while all your closers are busy is a paid call that goes nowhere. Match transfer hours and concurrency to the people who will actually pick up. Read our solar live transfer leads guide for the operating details. Live transfer availability for your territory is confirmed on the call.
Inbound calls versus warm transfers
An inbound call comes directly from a homeowner who dialed a tracked number, often from an ad or a listing. A warm transfer comes from a screening agent who spoke with the homeowner first and then connected them. Inbound calls are often more motivated, because the homeowner chose to dial. Warm transfers are often better qualified, because a screener asked questions first. Both are usually priced per billable call. Compare them on cost per qualified conversation and cost per set, using your own call dispositions.
How do battery storage, system size and financing change what a lead is worth?
What you can afford to pay for a solar lead depends on what the average resulting job is worth to you. Larger systems, battery add-ons and higher-margin financing types raise the gross margin per sale, which raises the maximum cost per sale you can tolerate. The same lead price can be profitable for one installer and a loss for another.
This is the half of the cost question that price pages skip. They tell you what leads cost. They do not tell you what a lead is worth, because that depends on your jobs.

Working out your maximum cost per sale
Illustrative example. Take your average gross margin per installed job after equipment, labor, permitting, overhead allocation and sales commission. Decide what share of that you are willing to spend on lead acquisition. If average gross margin is $6,000 and you will spend up to 40% on leads, your maximum lead cost per sale is $2,400. Every source must come in under that number once you have enough data to judge.
Now change the job. If a battery attaches to a third of your sales and adds margin, your average margin rises and so does your ceiling. If financing shifts toward a product that pays you less, your ceiling falls. Recompute the ceiling every quarter, and recompute it by source if different sources bring different job mixes.
Job mix by source
Different sources can bring different jobs. A source that runs ads about backup power may bring more battery buyers. A source that runs ads about bill savings may bring more price-sensitive buyers. Track average contract value and battery attach rate by source in your monthly sheet. A source with a higher cost per sale can still be your most profitable if its jobs are larger.
Financing type after 25D
The end of the 25D credit for systems placed in service after 2025, per the IRS, changed the math on cash and loan sales. If more of your closes are now leases or PPAs, the margin per sale may differ from what it was in 2025. Recompute your ceiling with 2026 job data, not 2025 data. Our guide to solar leads after 25D covers how this shifts lead strategy. Talk to your tax advisor about specific projects.
How should you split a lead budget across products?
Split a lead budget by putting most of it into the product that has proven the lowest cost per sale for your team, a smaller share into a second product as a hedge, and a fixed test share into anything new. Rebalance monthly on cohort data. Avoid spreading a small budget across so many sources that none produces a readable result.
The core, hedge and test split
A simple structure that works for most teams:
- Core: the source with the best proven cost per sale. It gets the largest share of budget and the best setter hours.
- Hedge: a second source that has also worked, so one vendor's bad month does not stop your pipeline.
- Test: a small fixed amount each month for something new: a new product, vendor, ZIP cluster or filter set.
Illustrative example. A team with a $30,000 monthly budget might put $20,000 into its core exclusive source, $7,000 into a hedge (a second exclusive vendor or live transfers), and $3,000 into a test (aged leads for the new setter, or appointments in a new county). The exact percentages matter less than the discipline: the test share has a written end date and pass or fail criteria.
Minimum readable spend per source
Each source needs enough spend to produce a readable number of appointments each month. If your budget is small, fewer sources are better. Two sources each producing 20 appointments teach you more than five sources each producing 8. If you cannot afford a readable test of a new source this month, wait until you can.
Rebalancing rules
- Move budget in steps, not all at once. A source that performed well at 100 leads may not hold its rates at 300, because the vendor has to reach further into its traffic to deliver more.
- Rebalance on cohort data at least 45 to 60 days old, so sales have had time to close.
- Keep the hedge alive even when the core is performing. Vendors change, and rebuilding a second source from zero takes months.
How should you run a 90-day lead pilot?
A good 90-day pilot buys a small, fixed batch from one or two sources, measures every stage of the funnel by source, and makes a keep, change or stop decision at day 30, 60 and 90 using cost per sat appointment first and cost per sale last. Set the kill criteria before the first lead arrives, and write them down.
Most failed lead tests fail on design, not on the vendor. The batch was too small, the team was not ready, the CRM did not tag source, or the owner judged the vendor on week one. The plan below is built to avoid those mistakes.
Before day 1: setup checklist
- CRM has a required "lead source" field and a "vendor lead ID" field on every record.
- Every stage (contacted, set, sat, signed, cancelled) has a date field so you can measure time between stages.
- Delivery is wired into the CRM or dialer directly. Our leads arrive by real-time delivery to your CRM, dialer, email, or SMS.
- A named person owns speed-to-lead during delivery hours. See our solar speed to lead guide for cadence rules.
- Return process is assigned to one person with a daily check.
- Consent certificates are stored and retrievable by lead ID.
- Kill criteria and scale criteria are written and agreed by the owner and sales manager.
- Baseline rates from your existing sources (referrals, own ads) are recorded for comparison.
Writing kill and scale criteria
Illustrative example. An installer with an average gross margin per job it can afford to spend partly on acquisition decides it can tolerate a lead cost per sale of up to $3,000. Working backward through assumed close and sit rates, that implies a maximum cost per sat appointment of about $750 and a maximum cost per set appointment of about $525. The criteria then read:
- Day 30: Stop if cost per set appointment is above $700 and contact rate is below 40%. Continue otherwise.
- Day 60: Stop if cost per sat appointment is above $900. Adjust (filters, hours, ZIPs) if between $750 and $900. Continue if below $750.
- Day 90: Scale by 50% if projected lead cost per sale is below $2,500. Hold volume if between $2,500 and $3,000. Stop if above $3,000.
Those numbers are made up. The method is not: pick your tolerable cost per sale from margin, walk it backward through your expected funnel rates, and attach a decision to each checkpoint.
Month 1: get clean data
The first month is about whether the leads are real and reachable. Look at:
- Contact rate within 24 hours. Low contact rates on supposedly fresh leads point to bad phone data, slow delivery, or shared inventory sold as exclusive.
- Wrong-number and "didn't request" rate. Listen to calls. If many homeowners say they never asked about solar, ask the vendor for the traffic source and the consent record for those leads.
- Return rate. Track by reason. Data defects are the vendor's problem; outcome problems are yours.
- Speed-to-first-call. If your own median is over five minutes, fix that before judging any vendor.
Do not judge sales in month 1. Many sales from month-1 leads close in month 2 or 3.
Month 2: judge appointments
By day 60, month-1 leads have had time to set and sit. Now the meaningful numbers appear:
- Set rate of contacted leads
- Sit rate of set appointments
- Cost per sat appointment by source
- Early closes, with the caveat that the sample is still small
This is the right time for a vendor conversation. Share your stage data, ask about traffic sources behind your best and worst leads, and ask whether filters or geography could improve the weak segments.
Month 3: judge sales and decide
By day 90, you have about two months of leads with enough time to close. Compute:
- Lead cost per sale and fully loaded cost per sale, by source
- Cancellation rate of signed deals, because a sale that cancels before install is not a sale
- Average contract value by source, since some sources may bring larger systems or battery add-ons
Then decide: scale, hold, adjust, or stop. Write down the reason so the next review starts from a record, not a memory.
Pilot size: how many leads is enough?
A pilot is big enough when it produces enough appointments to see a pattern. Illustrative example: if you expect a 20% lead-to-appointment rate and want 25 appointments to judge, you need about 125 leads. If you expect 10%, you need about 250. Smaller pilots are fine for spotting obvious failures (no contacts, no consent records) but too noisy for a scale decision. Use the solar lead cost calculator to size a test batch from your own rates, then book a call to price it for your ZIP codes.
How should you track solar lead cost each month?
Track solar lead cost in one sheet or CRM report with one row per source per month. Record spend, leads, credits, contacts, sets, sits, sales, cancellations and revenue, then compute cost per contact, per set, per sit and per sale. Review it weekly for pacing and monthly for decisions, and keep at least 12 months of history.

Tracking template: columns
Copy these columns into a spreadsheet. One row per source per month.
| Column | Definition | Where it comes from |
|---|---|---|
| Month | Calendar month the leads were delivered | Vendor invoice |
| Source | Vendor and product (e.g. Vendor A exclusive) | CRM source field |
| Gross spend | Total invoiced | Invoice |
| Credits | Approved credits for that month's leads | Vendor credit report |
| Net spend | Gross spend minus credits | Calculated |
| Leads delivered | Count delivered | CRM |
| Leads returned | Count credited | Vendor credit report |
| Contacts | Leads with a two-way conversation | CRM stage date |
| Sets | Appointments booked | CRM stage date |
| Sits | Appointments held with decision makers | CRM stage date |
| Sales | Signed contracts | CRM stage date |
| Cancels | Signed contracts cancelled before install | CRM |
| Net sales | Sales minus cancels | Calculated |
| Contract value | Sum of net sales value | CRM |
| Cost per contact / set / sit / net sale | Net spend divided by each count | Calculated |
Cohort, not calendar
Attribute sales to the month the lead was delivered, not the month the contract was signed. A lead bought in March that closes in May belongs to March's row. Calendar-based reporting makes a vendor look great the month after you cut its volume and terrible the month you scale it, because sales lag spend. Cohort reporting fixes that.
Weekly review: five questions
- Is each source pacing to its monthly budget?
- Is our median speed-to-first-call under target for each source?
- Have all qualifying returns been submitted?
- Has any source's contact or set rate dropped sharply versus its 4-week average?
- Are any appointments from last week unconfirmed?
Monthly review: three decisions
- For each source: scale, hold, adjust or stop.
- Where to move budget freed from stopped sources.
- Which one funnel stage to improve next month (speed, set script, confirmation, close).
Illustrative case walkthroughs
The four walkthroughs below show how lead cost decisions play out in practice: a cheap source that was not cheap, appointments that did not sit, aged leads used for training, and a vendor whose quality slipped. They are illustrative composites, not real companies, customers or results, and every number is a hypothetical input used only to show the reasoning.
Walkthrough 1: the cheap shared leads that weren't cheap
Illustrative example. A five-rep installer buys shared leads at $40 because the price looks safe. After 60 days, the owner sees contact rate at 30% and set rate at 15% of contacts. Lead-to-set is 4.5%, so each set appointment costs about $889 in lead spend alone. Listening to calls, the setter hears the same thing again and again: "I've already talked to three companies today."
The owner runs the conversion ladder on an exclusive alternative at $150, assuming a 65% contact rate and 35% set rate from a small pilot. Lead-to-set is about 22.8%, so each set costs about $659. The more expensive lead is cheaper per appointment for this team. The owner keeps a small shared allocation for the setter's peak hours, when speed is good, and moves the rest of the budget to exclusive.
Lesson: the right lead type depends on how fast you can call. Read exclusive vs shared solar leads for the break-even math.
Walkthrough 2: appointments that didn't sit
Illustrative example. An owner-operator buys booked appointments at $300 each. The first ten appointments produce four sits. At a 40% sit rate, each sit costs $750. The owner reads the vendor agreement and finds that no-shows are replaced only if reported within 48 hours, and he missed the window on three.
He changes two things: a confirmation text and call the evening before each appointment, and a calendar reminder to report no-shows the same day. On the next twenty appointments the sit rate improves and the replaced appointments lower his effective cost per sit. The vendor did not change. His process did.
Lesson: for appointments, confirmation and reporting discipline are part of the price.
Walkthrough 3: aged leads as a training ground
Illustrative example. A growing team hires two new setters. Rather than practice on fresh exclusive leads, the manager buys a batch of aged leads at a low unit price and has the new setters work them for two weeks with daily call reviews. The aged batch produces a handful of appointments and one sale. On a cost-per-sale basis it is unremarkable. On a training basis it is cheap: the new setters learned the script on records that cost a small fraction of a fresh lead.
Lesson: aged leads can have value that does not show up in cost per sale. Price them for the job you are giving them. See aged solar leads for what to check, including consent.
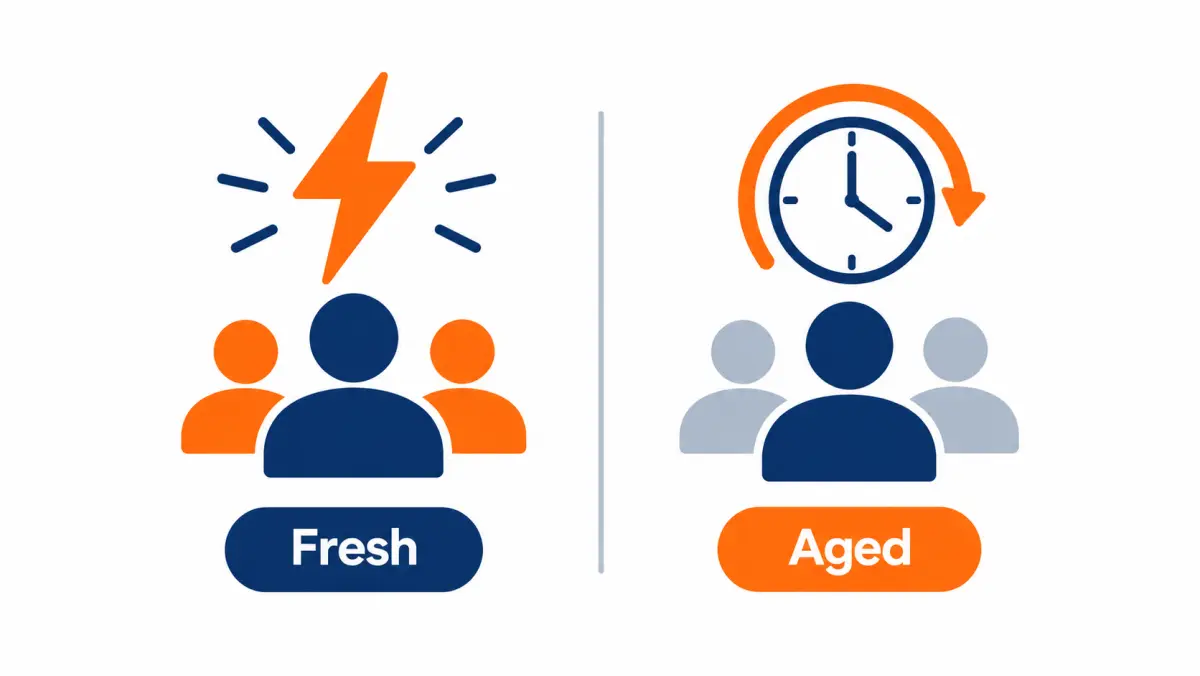
Walkthrough 4: the vendor that got worse
Illustrative example. A mid-size installer has bought from the same vendor for a year with stable results. Over six weeks, return requests for wrong numbers double, and setters report more homeowners who say they did not request a quote. Contact rate falls. The vendor's price has not changed.
The manager asks for traffic source by lead and finds that a new social campaign is producing a growing share of volume. Leads from that source contact poorly and set rarely. The vendor agrees to exclude that source for this buyer. Contact rate recovers within a month.
Lesson: lead quality can change without a price change. Track return rate and contact rate weekly by source, and ask for source-level data when they move.
What the walkthroughs have in common
In each case, the decision was made on a number further down the funnel than the sticker price. In each case, the fix was either a change in the team's process or a change in what was bought, rather than a cheaper price. That pattern holds for most installers we talk to: process and product fit move cost per sale more than negotiation does.
What can you do when leads cost too much in your market?
When leads in your market cost more than your ceiling allows, you have five levers: improve a funnel stage, change the product, widen or reshape territory, raise value per job, or shift budget to channels you control. Lowering the price you pay is usually the smallest lever. Start with the stage where your team loses the most leads.
Installers in expensive markets often conclude that buying leads "doesn't work here." Sometimes that is true for a given team and product. More often one or two changes bring cost per sale back under the ceiling.
Lever 1: fix the weakest stage
Take your cohort numbers and find the stage furthest below where it should be. Illustrative example: if your contact rate on exclusive leads is 45% and your median speed-to-first-call is 22 minutes, moving to under 2 minutes is likely to do more for cost per sale than any discount. If your sit rate is 50% because appointments are booked a week out, booking within 48 hours and confirming the night before may lift it substantially. Each stage multiplies through the whole funnel, so a 20% lift in one stage lowers cost per sale by about 17%.
Lever 2: change the product
If your team cannot staff speed, appointments or transfers may cost less per sale despite higher unit prices. If you have dialer capacity and setters with time to spare, shared or aged leads may stretch your budget further. Run the conversion ladder for each candidate product with realistic rates for your team.
Lever 3: reshape territory
Prices often differ between neighboring areas. Illustrative example: an installer focused on a single expensive metro might add surrounding counties within crew range, where competition for leads is thinner. The blended price falls and travel rises slightly. Check that the added ZIPs have homes that fit your filters, and that your crews can reach them without wrecking install schedules. State-level patterns are covered in our solar lead cost by state guide.
Lever 4: raise value per job
A higher ceiling makes the same lead affordable. Battery attachment, larger systems where usage supports them, roof work where you are licensed, and EV charger installs can all raise gross margin per sale. Track contract value by source; some sources may bring higher-value jobs and deserve a higher ceiling.
Lever 5: shift to channels you control
Referrals, reviews, community events, partnerships with roofers or electricians, and your own ads all produce exclusive leads with your brand on them. They take longer to build and still cost money, but they reduce dependence on purchased leads in an expensive market. Most teams keep buying leads to fill the gaps while these channels grow.
What not to do
- Do not buy cheaper leads outside your crew range just to lower the average price.
- Do not cut confirmation or follow-up staff to fund more leads; that usually lowers sit and contact rates.
- Do not drop compliance requirements to get a lower price.
- Do not spread a shrinking budget across more vendors.
| Change | Stage affected | New cost per sale |
|---|---|---|
| Contact rate up from 50% to 60% | Contact | $2,500 |
| Set rate up from 30% to 36% | Set | $2,500 |
| Sit rate up from 60% to 75% | Sit | $2,400 |
| Close rate up from 25% to 30% | Close | $2,500 |
| Price down 10% | Price | $2,700 |
In this made-up example every funnel improvement beats a 10% price cut. The pattern holds generally because cost per sale is the price divided by the product of the rates: a proportional gain in any rate has the same effect as an equal proportional cut in price, and funnel gains of 20% or more are often more achievable than price cuts of 20%.
How do you price aged leads by the work they need?
Price aged leads by cost per contact, not per record, because most of the expense is the dialing time needed to reach anyone. The published per-record ranges, from $0.10 to $10+ via ActiveProspect and up to $5 to $30 at LeadGen Economy, look tiny next to fresh leads. Once you add setter hours per contact, the gap narrows.
Aged leads are where the sticker price misleads most. A record at under a dollar seems free. But if your setter has to dial many records to reach one person, the labor dwarfs the record cost.
Illustrative aged lead math
Illustrative example. Hypothetical inputs only. You buy 2,000 aged records at $1 each, or $2,000. Your power dialer and one setter work them over two weeks. Contact rate is 15%, so you reach 300 people. Of those, 8% set an appointment: 24 appointments. Sit rate is 55%: about 13 sits. Close rate on sits is 15%: about 2 sales.
- Record cost per sale: $2,000 / 2 = $1,000
- Setter time: 80 hours at $25 fully loaded = $2,000, or $1,000 per sale
- Dialer and SMS usage for the batch, say $300, or $150 per sale
- Fully loaded cost per sale: about $2,150
Half the cost is labor. If your setter is twice as efficient, aged leads look excellent. If your setter is new and slow, they look poor. The record price barely moves the result.
What to check before buying aged records
- Age band. Ask for the exact range (31 to 60 days, 61 to 90, older). Contact rates fall with age.
- Times sold. How many buyers have already had this record?
- Consent. Does the original consent cover your company calling now? This is the single biggest risk with aged inventory. Confirm with counsel.
- DNC scrub. Has the batch been scrubbed recently, not just at the original sale?
- Original form fields. What did the homeowner answer, and how much of it is still likely true?
Aged availability for your territory is confirmed on the call. See aged solar leads for the product category in depth.
A one-page lead cost policy you can adapt
A written lead cost policy keeps buying decisions consistent when the owner is busy and the sales manager is under pressure to fill calendars. It states the maximum cost per sale, how sources are tested and judged, who approves spend, and when a source is paused. One page is enough. Review it every quarter.
The template below is a starting point. Replace bracketed items with your own numbers and names.
Template
Lead cost policy, [Company], effective [date]
- Ceiling. Maximum lead-only cost per net sale is [$X], set from average gross margin per job of [$Y] and an acquisition share of [Z%]. Fully loaded ceiling is [$X2].
- Units. All sources are compared on cost per contact, cost per sit and cost per net sale, using cohort reporting by delivery month.
- New sources. Every new source starts with a test batch sized to produce at least [N] set appointments. Test budget is capped at [$T] per month.
- Checkpoints. New sources are reviewed at day 30 (contact and set rates), day 60 (sit rate and cost per sit), and day 90 (cost per net sale). Criteria for each checkpoint are written before the test begins.
- Approval. Spend above [$A] per month per source requires owner approval.
- Returns. [Name] submits qualifying returns daily. Return rate by source is reported weekly.
- Speed. Median speed-to-first-call target is [minutes] during staffed hours. Sources deliver only during staffed hours unless routed to a morning queue.
- Compliance. No source is approved without per-lead consent records and DNC scrubbing. Vendor agreements are reviewed by counsel.
- Pause rule. Any source whose cost per sit exceeds [$P] for two consecutive weeks is paused pending review.
- Review. This policy and the ceiling are reviewed quarterly.
Who owns what
| Role | Owns | Reviews |
|---|---|---|
| Owner | Ceiling, approval, vendor contracts | Monthly cost per net sale by source |
| Sales manager | Speed, scripts, setter and closer coaching | Weekly stage rates by source and rep |
| Setter lead or ops | Returns, data hygiene, delivery hours | Daily returns and delivery timestamps |
| Bookkeeper | Invoices, credits, prepaid balances | Monthly reconciliation of spend and credits |
How should you run a monthly vendor review?
Run a monthly vendor review as a 30-minute call with a fixed agenda: your cohort numbers by stage, returns and their reasons, traffic source changes, and next month's volume and geography. Send your numbers in advance. Vendors who see that you measure carefully tend to protect your account, and the conversation stays on facts.
Agenda
- Numbers (10 minutes). Share last month's leads, contacts, sets, sits and early sales, plus the prior cohort's sales now that it has matured.
- Returns (5 minutes). Count by reason. Any patterns?
- Sources (5 minutes). Has the vendor's traffic mix changed? Any new campaigns or partners?
- Adjustments (5 minutes). Filters, ZIPs, hours, caps.
- Next month (5 minutes). Volume, price, any changes in terms.
What to send beforehand
- Cohort table for that vendor (last three months)
- List of returned leads with reasons
- Ten call notes: five good, five bad, with lead IDs
- Proposed changes for next month
What to listen for
- Willingness to show traffic source by lead
- Specific explanations for changes, rather than general reassurance
- Offers to adjust filters or geography rather than just price
- Any reluctance to put agreed changes in writing
A vendor relationship built on monthly data tends to get better over time. A relationship built only on price tends to get renegotiated every quarter.
Pre-purchase checklist
Use this checklist before you sign up with any solar lead source, including us. It condenses the pricing parts of this guide into four groups you can tick off in one sitting: your own numbers, the product definition, the written terms, and the test plan. Anything left unticked is a question for the vendor.
Know your numbers
- Average gross margin per job, recalculated with 2026 job data
- Maximum lead-only and fully loaded cost per sale
- Current contact, set, sit and close rates by existing source
- Median speed-to-first-call during staffed hours
Know the product
- Product type and buyer count, in writing
- All-in price for your ZIPs and filters
- Copy of the homeowner form and consent disclosure
- List of pre-delivery checks, verified versus self-reported
- Delivery method, speed, hours, caps
Know the terms
- Replacement policy: covered defects, exclusions, window, mechanics
- Minimums, prepayment and refund of unused balances
- Contract term and notice to pause or stop
Know your plan
- Test batch size and budget
- Day 30, 60 and 90 criteria written down
- CRM source tagging tested end to end
- Return process owner named
- Counsel has reviewed consent and vendor terms
When the list is done, book a call to price a test batch for your ZIP codes, or run your own numbers first in the solar lead cost calculator. For the broader buying process, start at our guide to buying solar leads.
Illustrative monthly P&L for a six-rep team
A monthly lead P&L puts every acquisition cost and every resulting sale for one month's cohort on a single page, so the owner can see fully loaded cost per sale by source. The worked example below is hypothetical and shows the layout, not a benchmark. Build the same page from your own CRM and invoices.
Illustrative example. Every number is a hypothetical input; none are quotes, benchmarks or results from any vendor, including us. A team with six closers and two setters buys from two sources in March and tracks the March cohort through May.
| Line | Source 1: exclusive leads | Source 2: live transfers | Total |
|---|---|---|---|
| Units bought | 180 at $150 | 60 at $210 | |
| Gross spend | $27,000 | $12,600 | $39,600 |
| Credits | $1,500 | $630 | $2,130 |
| Net spend | $25,500 | $11,970 | $37,470 |
| Setter labor allocated | $5,000 | $1,000 | $6,000 |
| Closer time and software allocated | $1,800 | $1,200 | $3,000 |
| Fully loaded cost | $32,300 | $14,170 | $46,470 |
| Net sales (after cancels) | 9 | 5 | 14 |
| Lead-only cost per net sale | $2,833 | $2,394 | $2,676 |
| Fully loaded cost per net sale | $3,589 | $2,834 | $3,319 |
How to read it
- Allocate labor honestly. Setters spend most of their time on web leads, so most setter cost goes to Source 1. Transfers use closer time instead. If you split labor evenly, you would flatter the web leads.
- Measure at a fixed age. Day 75 gives most March leads time to close. Re-run the page at day 120 to catch late closes, and note the change.
- Do not over-read small counts. Five sales from transfers is a thin sample. In this example the owner would keep both sources, nudge a little budget toward transfers, and re-check next month rather than make a large switch.
- Check job value too. If Source 1 jobs average larger systems or more batteries, its higher cost per sale may still produce more gross profit. Add a contract value line when you have it.
Why is my cost per sale rising? A troubleshooting guide
When cost per sale rises, find the funnel stage that moved before you blame the price. Compare this month's contact, set, sit and close rates with your trailing average by source. The stage that dropped tells you whether the problem is lead quality, speed, setting, confirmation or closing, and each has a different fix.
Rising cost per sale is the most common reason installers call a vendor angry or drop a source. Sometimes the vendor is the cause. Often it is not. A structured check takes an hour and prevents dropping a good source for a problem inside your own team.
Diagnostic table
| Stage that dropped | Likely causes | What to check | Typical fix |
|---|---|---|---|
| Contact rate | Slower speed-to-lead, bad phone data, leads shared more widely, delivery outside staffed hours | Median time to first call, wrong-number rate, delivery timestamps | Fix speed and hours; return bad data; ask vendor about source mix |
| Set rate | Lower intent traffic, new or tired setters, script changes, homeowners already quoted | Call recordings, set rate by setter, "already talked to others" mentions | Coach setters; ask vendor about traffic sources; tighten filters |
| Sit rate | Weak confirmation, appointments set too far out, decision maker missing | Days between set and sit, confirmation completion | Set within 48 to 72 hours; confirm night before; require both owners |
| Close rate | Pricing, financing approvals, closer performance, post-25D buyer economics | Close rate by closer, finance denial rate, lost-deal reasons | Closer coaching; financing options; refresh proposals |
| Cancellation rate | Pressure closes, slow install timelines, financing changes | Days from sign to install, cancel reasons | Faster scheduling; welcome call; review closer behavior |
| Lead price | Vendor raised price, mix shifted to costlier ZIPs or filters | Invoice detail by ZIP and filter | Renegotiate; adjust geography or filters |
Step-by-step check
- Pull cohort data. Last full month versus trailing three-month average, by source. Use lead delivery month, not sign date.
- Find the stage. Compute each rate. Mark the one that fell the most.
- Separate your team from the leads. If the drop shows across every source, it is probably your team or market. If it shows in one source, it is probably that source.
- Listen to ten calls. Pick five recent losses and five wins from the problem source. Patterns in what homeowners say are faster than any report.
- Talk to the vendor with data. Share the stage numbers and the call notes. Ask about traffic changes.
- Change one thing at a time. If you change speed, script and filters in the same week, you will not know which one worked.
Five problems that look like lead quality but are not
- A setter left. The new setter's set rate is lower for a few weeks. Leads did not change.
- Calendar filled up. Closers had no slots for a week, so setters booked appointments too far out and sit rate fell.
- Dialer caller ID got flagged. Contact rate dropped because calls show as spam. Check your numbers' reputation.
- Financing partner tightened. Close rate fell across all sources at once.
- Seasonal shift. Homeowner attention changes around holidays and extreme weather. Compare against the same month last year if you have it.
When during the year do lead costs and results shift?
Solar lead results shift during the year because homeowner attention, ad auction competition and installer capacity all change with the seasons and the calendar. We could not find a dated public dataset that measures month-by-month solar lead prices, so plan around your own history rather than a published seasonal curve.
That said, several mechanisms are predictable even without a published curve:
- Ad auctions get more competitive when many advertisers chase the same consumers, such as around major retail holidays. Lead vendors buy traffic in those auctions, so their costs can rise.
- Homeowner attention drops during holidays and vacations. Contact and sit rates can fall even if lead price holds.
- High utility bills in the hottest or coldest months can raise interest in savings. That can lift set rates for leads generated during those months.
- Policy deadlines pull demand forward. The end of 25D for systems placed in service after 2025 created a rush in late 2025 for cash and loan buyers. A similar pattern can repeat around any future deadline.
- Installer capacity matters. If your crews are booked for months, a lead that converts today waits a long time for install, and cancellations can rise.
How to plan around it
- Keep at least 12 months of cohort data by source. After a year you will have your own seasonal curve.
- Lower volume ahead of known slow weeks rather than paying for leads nobody will call.
- Raise volume ahead of high-intent periods if your team and crews can handle it.
- Do not judge a source on a holiday month alone.
What questions should you ask before you buy solar leads?
Before buying solar leads, ask about the product definition, consent, validation, delivery, returns, and terms, and get every answer in writing. The questions below cover price-related issues; our vendor-vetting guide covers broader due diligence. A vendor that cannot answer clearly is telling you something about its leads.
Product and price
- What exactly is the product: web form, call, transfer, or appointment?
- How many buyers receive each lead? Is it ever resold later, including as aged inventory?
- What is the all-in price for my ZIP codes and filters?
- Is there a test batch, and what does it cost?
- Are there monthly minimums or prepayment requirements?
Quality and compliance
- Can I see the form the homeowner filled out?
- Does each lead carry a timestamped consent record that names my company? Can I get it on request?
- Which checks happen before delivery, and which are verified versus self-reported?
- What traffic sources produce the leads? Can I see source by lead?
- How is the Do Not Call Registry handled? See the FTC Telemarketing Sales Rule page for the rule framework behind the Registry, and confirm your obligations with counsel.
Delivery and operations
- How are leads delivered, and how fast?
- Can I set delivery hours, daily caps and pause at short notice?
- How do you de-duplicate against leads already sent to me?
Returns and terms
- Which defects qualify for credit, within what window, and how do I submit?
- Are credits refunds, credits on future batches, or replacement leads?
- What is the contract term and the notice period to stop?
How we answer these
For transparency, here is how our offer answers several of these on paper. Each exclusive lead is sold to one company and is never resold, recycled or sold later as an aged lead. Every lead carries a timestamped consent record whose disclosure names your company, sent on request. Before delivery: phone number validated, homeowner status self-reported then checked against property records, duplicate-checked against leads already sent to you, and scrubbed against the National Do Not Call Registry. Delivery is real time to your CRM, dialer, email or SMS. Replacement credits cover disconnected numbers, wrong contact details, or leads outside your filters within 7 days. No long-term contracts. Pricing is confirmed by ZIP on your call, and territory availability is confirmed by ZIP code on the same call. Book a 30-minute strategy call to go through the rest.
How does compliance affect what a solar lead costs you?
Compliance affects lead cost because a lead you cannot legally call is worth nothing, and a lead that triggers a complaint or claim can cost far more than its price. Paying slightly more for leads with clear, company-specific consent records and Do Not Call scrubbing is usually cheaper than handling the fallout from leads without them. Confirm your obligations with counsel.
This is not legal advice. It is a cost lens on a legal topic.
The cost of a bad record
A cheap lead with weak consent creates three kinds of cost:
- Direct risk. Telemarketing laws such as the Telephone Consumer Protection Act create exposure for calls and texts made without the required consent. The FCC administers the TCPA rules.
- Operational cost. Time spent handling complaints, pulling records and responding to letters.
- Reputational cost. Carrier spam labeling on your numbers lowers contact rates on every lead, including good ones.
What changed in 2025
The FCC's one-to-one consent rule, which would have required consent to name each seller individually, was vacated by the Eleventh Circuit on January 24, 2025. Some guides still describe it as live. That ruling does not mean any consent language is acceptable. Many installers still prefer consent records that name their company, because it is the cleanest evidence. Our leads carry a consent certificate whose disclosure names your company. State laws may add their own requirements. Read our solar leads TCPA compliance guide and confirm with counsel.
Building compliance into the price comparison
Add a compliance column to your vendor sheet:
- Consent record provided per lead? (yes or no)
- Disclosure names your company? (yes or no)
- DNC scrub before delivery? (yes or no)
- Records retained and retrievable for how long?
A vendor that answers "no" to any of these should not win on price alone.
Should you buy leads or generate your own?
Most installers do both. Generating your own leads gives you exclusive, branded leads and full control of consent, but it takes months to tune and carries fixed costs. Buying leads gives you volume and predictable unit prices quickly. Compare them on fully loaded cost per sale over the same period, including the months your own campaigns spent learning.
The in-house section earlier in this guide covers the per-lead math. This section covers the decision over time.
Build versus buy over 12 months
Illustrative example. Hypothetical inputs only. An installer considers launching its own paid search and social campaigns instead of buying exclusive leads.
- Months 1 to 3: Campaign setup, landing pages, tracking, creative. Cost per lead from own ads is high while the campaigns learn and the team tests offers. Purchased leads continue at the same budget to keep the pipeline full.
- Months 4 to 6: Own-ad cost per lead falls as targeting and pages improve. The team shifts a share of budget from purchased leads to own ads, but only when own-ad cost per sat appointment beats purchased leads for two months in a row.
- Months 7 to 12: Own ads stabilize. Purchased leads continue for volume in ZIPs where own ads are expensive or thin, and as a hedge if ad accounts are disrupted.
The mistake to avoid is cutting purchased leads in month 1 because own-ad leads "will be cheaper." For the first quarter they usually are not, and the pipeline gap shows up as idle crews two months later.
What you take on when you generate your own
- Consent and records. You become the party capturing consent. Your forms, disclosures and record retention need review. Confirm with counsel.
- Fixed costs. Agency or staff time, software, creative, tracking.
- Account risk. Ad accounts can be restricted or disapproved, cutting volume overnight.
- Management attention. Someone must watch spend daily.
What you gain
- Leads exclusive by definition
- Your brand on the first touch
- Full visibility into traffic sources
- An asset that improves over time as pages and audiences are tuned
A practical split
Many installers end up with a mix. Own ads and referrals form the base. Purchased exclusive leads fill volume and new territories. Appointments or transfers cover gaps in setter capacity. Aged leads train new setters or feed a nurture program. The right mix is the one with the lowest fully loaded cost per sale for your team, measured in the same CRM report.
How do you build your own solar lead cost benchmark?
Build your own cost benchmark by tracking every source in the same cohort report for at least two quarters, then computing your median and range for cost per contact, set, sit and sale by product. Your own benchmark beats any published range because it reflects your market, team and job mix. Update it quarterly.
Published ranges, including the ones in our price table, are useful starting points. They are also built by companies with commercial interests, define products differently, and do not publish sample sizes. After six months of clean tracking, your own numbers become the reference that matters.
Steps
- Standardize definitions. Write down what counts as a contact, a set, a sit, a sale and a cancel. Use the same definitions for every source.
- Tag every lead. Source, product, vendor lead ID, delivery timestamp.
- Collect two quarters. Fewer than that is usually too noisy, especially for close rates.
- Compute by product. Median and range per product, not just per vendor. You want to know what exclusive leads cost you in general, not only what Vendor A cost.
- Note context. Team changes, price changes, seasonality, financing changes. A benchmark without context gets misread.
- Review quarterly. Replace old data, keep the history.
Benchmark sheet layout
| Product | Leads (2 quarters) | Median cost per contact | Median cost per sit | Median cost per net sale | Context notes |
|---|---|---|---|---|---|
| Exclusive web leads | |||||
| Shared web leads | |||||
| Aged leads | |||||
| Live transfers | |||||
| Booked appointments | |||||
| Own paid ads | |||||
| Referrals |
Including referrals and own ads in the same sheet keeps purchased leads honest. If referrals cost you something (referral fees, events, gifts), put that in too.
Common myths about solar lead prices
Most solar lead price myths come from comparing different products or ignoring the funnel. The cheapest lead is not the cheapest sale, exclusive does not guarantee contact, appointments are not guaranteed sales, and a published range is not your price. Each myth below is paired with the check that exposes it.
Myth: cheaper leads mean lower acquisition cost. Check: run the conversion ladder. Low unit prices often come with low contact and set rates that raise cost per sale.
Myth: exclusive leads always convert better. Check: exclusivity removes competing callers on that request, but contact still depends on your speed and the lead's intent. A slow team can waste exclusive leads too.
Myth: appointments are the safest buy. Check: sit rate and definitions. An appointment that does not sit is a cost, and no-show terms vary widely.
Myth: price per lead tells you lead quality. Check: price reflects production cost and market, not quality. Two vendors at the same price can deliver very different contact rates.
Myth: the published average is what you should pay. Check: there is no reliable published average. Sources publish ranges with different definitions. Your price depends on ZIP, filters and product.
Myth: lead prices fell after 25D ended. Check: we could not find dated public data showing this. Vendors still buy traffic in competitive auctions. What changed most clearly is buyer economics, which affect close rates.
Myth: pay-per-sale has no risk. Check: fee size and billing triggers. Outcome pricing often carries a higher fee per sale than buying and closing leads well, and it requires pipeline visibility.
Myth: you should judge a vendor in the first two weeks. Check: time between stages. Sales from week-one leads may not close for weeks. Judge on contact and set rates early, sales later.
Glossary of solar lead pricing terms
These are the terms used throughout this guide, defined as we use them. Vendors may use them differently, so confirm definitions in writing before comparing prices.
Aged lead. A lead delivered well after the homeowner submitted it, often 30, 60 or 90 days later, and often sold before.
All-in price. The price per lead after every surcharge, filter fee, state premium and discount for your exact order.
Appointment set rate. Share of contacted leads who book a consultation.
Billable duration. Number of seconds a call must last before you are charged for it.
Booked appointment. A consultation already placed on your calendar by the vendor.
Cancellation rate. Share of signed contracts cancelled before installation.
Cohort reporting. Attributing results to the month a lead was delivered, not the month an outcome happened.
Consent record (certificate). A timestamped record of the homeowner's agreement to be contacted, including the disclosure text shown.
Contact rate. Share of leads your team reaches in a two-way conversation.
Cost per acquisition (CPA). Total acquisition cost divided by sales. We use "cost per sale" to avoid confusion with ad-platform CPA.
Cost per sale (lead-only). Lead spend divided by net sales.
Cost per sale (fully loaded). Lead spend plus labor, software and other acquisition costs, divided by net sales.
Exclusive lead. A lead sold to one buyer only. Confirm it is never resold later.
Filter. A criterion the lead must meet, such as homeownership or minimum bill.
Inbound call. A homeowner calling a tracked number directly.
Lead-to-sale rate. Net sales divided by leads delivered.
Live transfer. A call connected to your team by a screening agent after initial qualification.
Real-time lead. A lead delivered within seconds or minutes of submission. Says nothing about buyer count.
Replacement credit. A credit for a lead with a covered defect, under the vendor's policy.
Shared lead. A lead sold to more than one buyer.
Sit rate (show rate). Share of set appointments that happen with decision makers present.
Speed-to-lead. Time from lead delivery to first contact attempt.
TPO. Third-party ownership: leases and power purchase agreements.
How we gathered these numbers
We collected every price in this guide from public web pages fetched in October 2026, recorded the date each page displayed, and noted when a page attributed its numbers to another company. We did not use private quotes, and we did not publish our own prices.
Sources used
- ActiveProspect, "How much do solar leads cost", by Andrew Bailey, published July 31, 2026. Some ranges are attributed to The Leads Warehouse and Enervio.
- UpLead, "Buy Solar Leads", last updated October 2, 2026. Some figures attributed to Aged Lead Store and third-party reports.
- SolarReviews, "Best solar leads", no exact date shown; the page displayed "updated 1 year ago" when we fetched it.
- LeadGen Economy, "Solar lead generation complete guide", published December 26, 2025, updated April 21, 2026.
- IRS, Residential Clean Energy Credit, for the 25D end date.
- FCC, Telemarketing and Robocalls and FTC, Telemarketing Sales Rule, for the regulatory framework referenced in the compliance section.
What we could not verify
- Whether any of these ranges reflect actual transaction data or are editorial estimates. None of the pages publish sample sizes.
- Prices for specific vendors, which change by ZIP code and by month.
- Any first-party benchmark of our own. When we have enough real sales data to publish ranges, we will label them with dates and sample sizes.
We will re-check these sources each quarter and update the date at the top of the page only when the numbers have been re-verified.
FAQ
How much do solar leads cost?
Solar leads cost from about $0.10 to $500 each as of October 2026, depending on type. Public vendor guides list aged leads at $0.10 to $10+, shared leads at $25 to $100, exclusive leads at $100 to $250 or more, and booked appointments at $150 to $500. Prices also vary by state and by how many buyers receive each lead.
What is the average cost per solar lead?
There is no reliable published average. Sources report ranges, not averages, and they define lead types differently. For a fresh, exclusive residential lead, most 2026 sources cluster between $100 and $250. For shared leads, $25 to $100. Your own average depends on the mix you buy and the markets you target.
What is a good cost per lead for solar?
A good cost per lead is one that produces a cost per sale your gross margin can absorb. A $200 lead that closes at 6% costs about $3,333 per sale in lead spend; a $50 lead that closes at 1% costs $5,000. Set your target from margin per job and funnel rates, then test.
How much do exclusive solar leads cost?
Published ranges for exclusive solar leads run from $100 to $250 (ActiveProspect citing Enervio, July 2026), $100 to $200+ (LeadGen Economy, April 2026), and $150 to $300 for exclusive high-intent web leads (SolarReviews). Expensive markets such as San Diego can reach about $300 per lead according to SolarReviews and UpLead.
How much does a solar appointment cost?
Booked solar appointments are reported at $150 to $500 each (ActiveProspect citing Enervio, July 2026), with door-to-door appointments at $200 to $400+. Compare appointment prices on cost per sat appointment, because a share of booked appointments will not sit. Ask each vendor how no-shows are handled before you buy.
Why do solar leads cost so much?
Solar leads are expensive because the homeowner's decision is large, the advertising auctions for solar keywords are competitive, and only a small share of people who click an ad finish a qualifying form. A single residential sale can be worth tens of thousands of dollars, so many installers bid for the same small pool of interested homeowners.
Are cheaper solar leads worth it?
Cheaper solar leads are worth it only if your team can convert them at a rate that produces a lower cost per sale. Shared and aged leads suit fast, dialer-equipped teams. Small teams that cannot call within minutes often get a lower cost per sale from exclusive leads despite the higher price. Test both against your own numbers.
How much do solar companies pay for leads per sale?
SolarReviews estimates lead spend at roughly $0.25 per watt, or about $1,400 for an average 5.6 kW job, with anecdotal variation from about $500 per job in Texas and Florida to about $2,000 in California and Massachusetts. LeadGen Economy puts total customer acquisition cost at $1,500 to $3,000 per closed sale.
Do you publish your own prices?
No. Prices depend on ZIP code, lead type and filters, so pricing is confirmed by ZIP on your call. Every lead carries a timestamped consent record whose disclosure names your company, delivery is real time to your CRM, dialer, email or SMS, and there are no long-term contracts.
How much does a live transfer solar lead cost?
Inbound calls and live transfers are reported at $100 to $300+ per call by The Leads Warehouse, cited by ActiveProspect (July 2026). Most are billed once a call passes a set number of seconds. Your real cost is the price divided by the share of billable calls that become qualified conversations, so ask for the billable threshold before comparing.
How much do aged solar leads cost?
Published ranges for aged solar leads run from $0.10 to $10+ (ActiveProspect, July 2026), $0.60 to $1.50 for leads 30 to 85 days old (Aged Lead Store via UpLead, October 2026), and $5 to $30 for 30+ days (LeadGen Economy, April 2026). Judge them by cost per contact, because setter time usually costs more than the records.
How much do commercial solar leads cost?
We could not find a dated public price range for commercial solar leads that clearly defines the product, as of October 2026. Commercial leads are usually priced per qualified lead or per meeting, and their value depends on decision role, property control and project size. Agree on a written definition before comparing quotes.
How many leads do I need to buy to get one solar sale?
It depends on your lead-to-sale rate. Divide 1 by that rate: at an illustrative 4%, you need 25 leads per sale; at 2%, 50. Use your own last 90 days of cohort data if you have it, or run a test batch sized to produce at least 15 to 25 appointments before setting a budget.
What is a good cost per appointment for solar?
A good cost per appointment is one that keeps cost per sale under your ceiling after sit and close rates. Multiply your maximum cost per sale by your expected sit rate and close rate. At an illustrative $2,400 ceiling, 70% sit and 25% close, the maximum is about $420 per set appointment.
Should I count labor in solar lead cost?
Yes, at least in a second column. Setter wages, closer time, dialer and CRM seats, and management hours are real acquisition costs. A cheaper lead that needs more dialing can cost more per sale once labor is counted. Keep both a lead-only and a fully loaded cost per sale.
Do lead returns lower the price I pay?
Returns lower your effective price only if you claim them. If 12% of leads have covered defects and you claim none, your cost per usable lead is about 13.6% higher than the sticker price. Assign one person to submit qualifying returns daily within the vendor's window.
How long should I test a solar lead source before deciding?
Plan on about 90 days. Judge contact and set rates at day 30, sit rate and cost per sat appointment at day 60, and cost per net sale at day 90, using cohort reporting by delivery month. Sales from early leads often close weeks later, so judging on sales in the first month is premature.
Are real-time solar leads the same as exclusive leads?
No. "Real-time" describes delivery speed: the lead reaches you within seconds or minutes of the homeowner submitting it. "Exclusive" describes buyer count: only one company receives it. A real-time lead can be shared with several buyers. Ask every vendor both questions, how fast and to how many, before comparing prices.
Why do two vendors quote such different prices for the same lead type?
Because "the same lead type" is rarely the same product. Vendors differ in buyer count, form questions, filters, traffic sources, validation checks, delivery speed and return policies, and they price geography differently. Collapse each quote into an all-in price for your exact ZIPs and filters, then compare on cost per sat appointment from a test batch.
Is it cheaper to buy solar leads in bulk?
Volume commitments often lower the unit price, but a lower price only helps if your team can work the extra leads quickly. Leads that wait hours for a first call lose contact rate, which can erase the discount. Scale in steps, and check that contact and set rates hold at each new volume before committing to the next.