Solar Lead Cost by State in 2026, and Why Prices Differ
Solar lead cost by state: published ranges with sources, the factors behind them (rates, net metering, competition) and how to compare states by cost per sale.
Updated · 83 min read
In this guide (46 sections)
- Which states have the most and least expensive solar leads?
- State table with sources
- What makes solar leads expensive in some states?
- What changed for California solar leads after NEM 3.0?
- How do Texas, Florida and Arizona compare?
- Why are Northeast solar leads so expensive?
- Where are solar leads cheapest?
- What about mid-tier states like Colorado, Utah and the Carolinas?
- How should you compare states by cost per sale?
- How do you pick states to test?
- Which state policy changes should lead buyers watch?
- How do electricity rates compare across the major solar states?
- How to read the state profiles in this guide
- California: what drives solar lead cost in the most expensive large market?
- Texas: why are Texas solar leads priced mid-to-high despite lower electricity rates?
- Florida: what shapes solar lead cost in the Sunshine State?
- Arizona: how do export rates and utility type change Arizona lead value?
- Nevada: why are Nevada leads cheaper than their sun suggests?
- Utah: how does net billing shape lead economics?
- Colorado: what makes Colorado a mid-price market with steady demand?
- New York: how do NY-Sun and high rates shape lead cost?
- New Jersey: how do SREC-II and retail net metering affect leads?
- Massachusetts: why does Massachusetts sit near the top of both tables?
- Connecticut and Rhode Island: how do fixed-compensation programs change the pitch?
- Maryland, Pennsylvania and Virginia: what drives the Mid-Atlantic?
- Illinois: how did the 2025 net metering change affect lead value?
- North and South Carolina: how are Duke Energy's rule changes shaping leads?
- Georgia: is Georgia a value market or a trap?
- Hawaii: why are Hawaii solar leads the most expensive per lead?
- Do lead costs differ by utility within the same state?
- How do you research a state's solar economics yourself?
- How do you score and rank states for a lead budget?
- How should installers of different sizes approach state selection?
- How do you split a lead budget across states?
- What should your reps say differently in each state?
- Why did my cost per sale jump in one state?
- What about the Pacific Northwest, Midwest and Plains states?
- What questions should you ask a lead vendor about a specific state?
- Which state policy dates should a lead buyer track?
- State quick-reference summary
- Glossary of state solar terms
- How does seasonality differ by state?
- Illustrative walkthrough: rebalancing a two-state budget
- State buying checklist
- Methodology and sources
- FAQ
Solar lead cost by state ranges from roughly $15 to $35 per lead in North Dakota to $175 to $300 or more in California, according to per-lead ranges published by LeadGen Economy (updated April 2026). A second widely quoted table from SolarReviews shows a similar ranking but measures something different: lead cost per sale, from $225 in North Dakota to $1,929 in California. This guide puts both tables side by side with their columns labeled, explains why the two are often confused, and walks through the market forces that make some states expensive: electricity rates, net metering rules, installer density, customer sophistication and battery demand. It ends with the comparison that matters for an installer choosing where to buy, which is cost per sale against the margin you make on a job in that state. All figures are as of October 2026 and come from named public sources. None are our prices; pricing for your territory is confirmed by ZIP on your call.
Key takeaways (as of October 2026)
- Highest reported per-lead ranges: Hawaii ($200 to $350+), California ($175 to $300+), Massachusetts ($150 to $275), New York ($150 to $250). Lowest: North and South Dakota ($15 to $35), West Virginia and Wyoming ($20 to $40). Source: LeadGen Economy, updated April 2026.
- The SolarReviews state table ("California $1,929") reports lead cost per sale for multi-installer leads, not price per lead. Do not compare it with per-lead quotes.
- Expensive states are expensive because a sale there is worth more and more installers compete for it. A higher price per lead can still produce a better return.
- Compare states on cost per sale divided by gross margin per job. Use the solar lead cost calculator with your own rates.
Which states have the most and least expensive solar leads?
California, Hawaii, Massachusetts and New York have the most expensive solar leads in 2026, with published per-lead ranges from about $150 to $350 or more. North Dakota, South Dakota, West Virginia and Wyoming have the least expensive, at roughly $15 to $40 per lead, according to LeadGen Economy's state table updated in April 2026.
SolarReviews' cost-per-sale table ranks the states in a similar order. California sits at the top ($1,929 per sale for multi-installer leads from a defined, organic source), followed by Massachusetts and New Jersey ($1,400 each), New York ($1,357), Maryland ($1,333) and Connecticut ($1,286). North Dakota is at the bottom ($225), with Ohio ($300) next.
Why a single national average hides the story
A national "average solar lead cost" blends a $300 California lead with a $25 Kansas lead and reports a number that describes neither. It also blends lead types: exclusive, shared and aged inventory all get averaged together. For a buyer, the national figure is close to useless. You buy leads in specific ZIP codes, of a specific type, from a specific vendor. The useful question is what a lead of the type you want costs in your territory, and what that lead returns per sale. That is the question the rest of this guide answers, and it is also the question to put to any vendor quoting you a single number.
For the overall price ranges by lead type (aged, shared, exclusive, live transfer, appointments), see how much solar leads cost.
State table with sources
The table below combines the two public state-level datasets we could verify in October 2026. The first column is a per-lead price range. The second and third columns are lead cost per sale, which already factors in conversion. Read the column headers before you compare any two numbers.
| State | Cost per lead, typical range (LeadGen Economy, updated Apr 21, 2026) | Lead cost per sale, multi-installer leads, defined organic source (SolarReviews) | Lead cost per sale, multi-installer leads, undefined lower-quality source (SolarReviews) |
|---|---|---|---|
| Alabama | $30 to $60 | not listed | not listed |
| Alaska | $40 to $80 | $450 | $450 |
| Arizona | $80 to $150 | $613 | $833 |
| Arkansas | not listed | $450 | $400 |
| California | $175 to $300+ | $1,929 | $3,167 |
| Colorado | $90 to $160 | $557 | $725 |
| Connecticut | $100 to $175 | $1,286 | $2,667 |
| D.C. | not listed | $900 | $1,750 |
| Delaware | not listed | $357 | $833 |
| Florida | $100 to $175 | $488 | $550 |
| Georgia | $45 to $85 | $483 | $400 |
| Hawaii | $200 to $350+ | $563 | $975 |
| Idaho | $25 to $50 | $360 | $1,167 |
| Illinois | $50 to $90 | $360 | $400 |
| Indiana | $25 to $50 | $360 | $400 |
| Iowa | $30 to $60 | $360 | $400 |
| Kansas | $30 to $55 | $360 | $400 |
| Kentucky | $25 to $50 | $360 | $600 |
| Louisiana | $35 to $65 | $360 | $600 |
| Maine | $75 to $125 | $360 | $400 |
| Maryland | not listed | $1,333 | $2,167 |
| Massachusetts | $150 to $275 | $1,400 | $2,500 |
| Michigan | $35 to $65 | $360 | $367 |
| Minnesota | $40 to $70 | $650 | $900 |
| Mississippi | $25 to $50 | $450 | $367 |
| Missouri | $25 to $55 | $450 | $400 |
| Montana | $30 to $55 | $450 | $333 |
| Nebraska | $25 to $50 | $450 | $333 |
| Nevada | $50 to $90 | $483 | $600 |
| New Hampshire | $75 to $130 | $557 | $967 |
| New Jersey | $100 to $175 | $1,400 | $2,500 |
| New Mexico | $45 to $85 | $557 | $833 |
| New York | $150 to $250 | $1,357 | $2,633 |
| North Carolina | $50 to $95 | $363 | $600 |
| North Dakota | $15 to $35 | $225 | $333 |
| Ohio | $35 to $65 | $300 | $400 |
| Oklahoma | $30 to $60 | $360 | $333 |
| Oregon | $45 to $75 | $414 | $733 |
| Pennsylvania | $50 to $90 | $360 | $500 |
| Puerto Rico | not listed | $483 | $600 |
| Rhode Island | $90 to $150 | $656 | $1,300 |
| South Carolina | $45 to $85 | $613 | $725 |
| South Dakota | $15 to $35 | $450 | $400 |
| Tennessee | $30 to $60 | $483 | $600 |
| Texas | $100 to $175 | $557 | $633 |
| Utah | $45 to $80 | $700 | $1,300 |
| Vermont | $75 to $125 | $483 | $733 |
| Virginia | $50 to $90 | $360 | $667 |
| Washington | $40 to $70 | $483 | $800 |
| West Virginia | $20 to $40 | $450 | $300 |
| Wisconsin | $35 to $60 | $450 | $400 |
| Wyoming | $20 to $40 | $450 | $333 |
Sources: LeadGen Economy, "Solar Lead CPL by State" (published December 25, 2025, updated April 21, 2026; market data stated as current to December 2025). SolarReviews, "How much do solar leads cost in each state?" by Andy Sendy (no exact date shown; the page displayed "updated 2 years ago" when fetched in October 2026). "Not listed" means the source has no row for that state. Neither source is our pricing.
How the table was built
We fetched both pages in October 2026 and copied every state row as published. We did not adjust, average or interpolate any value. LeadGen Economy's table covers 47 states and omits Arkansas, Delaware and Maryland. SolarReviews covers 49 states plus D.C. and Puerto Rico and omits Alabama. We kept SolarReviews' own column descriptions word for word because the meaning of the number depends on them.
Exclusive vs multi-installer columns
Both SolarReviews columns describe multi-installer leads, meaning leads sold to more than one company. The table does not report exclusive leads. LeadGen Economy's ranges do not state a buyer count per state; its guide describes CPL benchmarks that "represent typical market conditions." If you buy exclusive leads, expect per-lead prices toward or above the top of the LeadGen Economy range for your state, and expect per-sale costs that differ from the SolarReviews columns because exclusive contact and close rates differ. Our explainer on exclusive vs shared solar leads covers that difference.
Where sources disagree
- The headline confusion. Many competitor pages and AI summaries state "the average solar lead costs $1,929 in California." The SolarReviews column is labeled as average lead cost per sale. That is the total lead spend needed to produce one sale, not the price of one lead.
- Texas. SolarReviews lists Texas at $557 per sale (defined source). We found at least one other vendor page quoting "$557 per lead" for Texas. That is the same number with the wrong unit.
- Within one source. LeadGen Economy's tier summary lists Texas at $75 to $150 per lead, while its state table says $100 to $175. Pennsylvania appears at $25 to $50 in the tier section and $50 to $90 in the table. We used the table values and flag the conflict here.
- Florida. Florida shows $488 and $550 per sale in the two SolarReviews columns. Competitor pages that quote "Florida $448" appear to have mistyped the first figure.
- Dates. The SolarReviews table has no specific date. Prices from 2024 or earlier may not reflect 2026 conditions after the end of the 25D credit.
How SolarReviews derives its numbers
SolarReviews explains that its US average comes from total customer acquisition cost of about $0.43 per watt, minus about $0.18 per watt paid to sales staff, leaving about $0.25 per watt for lead generation. For an average 5.6 kW residential job, that is about $1,400 of lead spend per sale. It describes the state variation as anecdotal, from about $500 per job in places like Texas and Florida up to about $2,000 in states like California and Massachusetts, and says the figures are a compilation of market prices rather than its own pricing.
What makes solar leads expensive in some states?
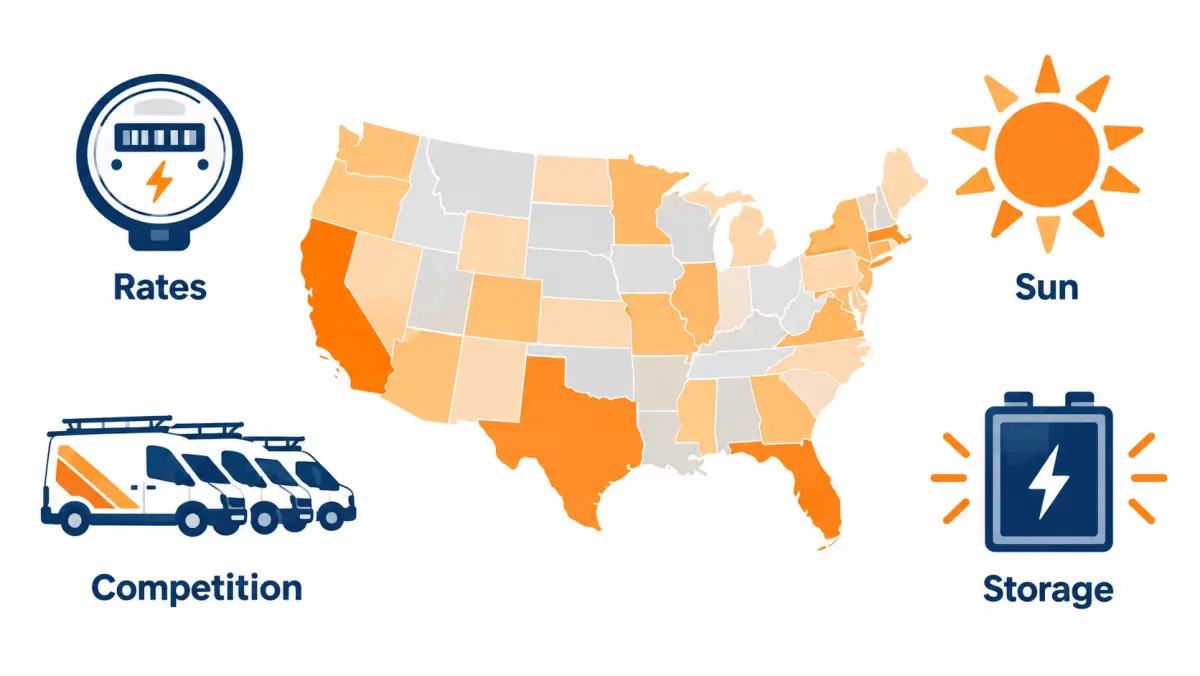
Solar leads cost more in states where solar saves homeowners more money, because more installers compete for those homeowners and pay more for the clicks that produce leads. High electricity rates, favorable net metering, strong state incentives, dense installer competition and high battery demand all push lead prices up.
Electricity rates
The savings case for solar is the gap between what a homeowner pays the utility and what solar costs per kilowatt-hour. Where retail rates are high, that gap is wide, more homeowners are interested, and each sale supports a bigger acquisition budget. The US Energy Information Administration's state electricity profiles publish average retail prices by state; the states at the top of those rankings, including Hawaii, California and much of New England, overlap closely with the most expensive lead markets in both tables above.
Incentives, net metering and net billing
How a utility credits exported solar power changes the payback period. States with full retail net metering make the savings math simple. States that moved to net billing, where exports earn less than the retail rate, push homeowners toward batteries and longer paybacks. State rebates, performance incentives and renewable energy credit markets add value on top. Strong incentives raise demand and raise lead prices. Weak or shrinking incentives reduce the pool of interested homeowners, which can lower price per lead but also lower close rates.
Installer density
Lead prices are set in an auction, directly (pay-per-click bidding) or indirectly (vendors raising prices when demand outpaces supply). Many installers in one metro means many bidders for the same homeowners. Shared leads in crowded markets also get called by more competitors, which lowers each buyer's contact rate.
Customer sophistication
Mature markets have homeowners who have already received three quotes from a neighbor's installer, read reviews and know what a fair price per watt looks like. They take longer to decide and compare harder. That lowers close rates and raises cost per sale, even if the lead price is the same as in a newer market.
Battery attach rate
Where batteries are commonly added to solar, average job values rise. A higher job value supports higher lead prices. California and Hawaii are examples where storage is a large part of the pitch. LeadGen Economy notes that lead generators targeting California increasingly need to qualify for storage interest, not just solar interest.
| Factor | Effect on price per lead | Effect on close rate | Net effect on cost per sale |
|---|---|---|---|
| High electricity rates | Up | Up | Often neutral to favorable |
| Generous net metering | Up | Up | Often favorable |
| Net billing transition | Mixed | Down for solar-only, steady with storage | Depends on your storage offer |
| Dense installer competition | Up | Down on shared leads | Unfavorable for shared |
| Sophisticated buyers | Neutral | Down | Unfavorable |
| High battery attach | Up | Neutral | Favorable if margin rises |
What changed for California solar leads after NEM 3.0?
California's net billing tariff, often called NEM 3.0, applies to new rooftop solar customers of the state's large investor-owned utilities who applied to interconnect from April 15, 2023, according to the California Public Utilities Commission. Exports are credited at lower avoided-cost values, which lengthened payback for solar-only systems and pushed installers toward solar-plus-storage.
What it means for lead economics
- Fewer solar-only buyers. The homeowner who wanted a simple panel system with fast payback has a weaker case. Leads that do not screen for storage interest or high bills convert worse.
- Higher job values. Adding a battery raises contract value, which can support a higher lead price per sale.
- Longer sales conversations. Explaining time-of-use rates, export values and battery dispatch takes more time and more skill, which affects closer capacity.
- Persistent high lead prices. Both state tables still put California at or near the top in 2025 and 2026 data. LeadGen Economy lists $175 to $300+ per lead. SolarReviews' $1,929 per-sale figure predates some of these changes because its page carries no exact date.
What we will not claim
We found no public, dated dataset that isolates the effect of NEM 3.0 on California lead prices. We do not state a percentage change. If your business depends on California, track your own cost per appointment and close rate by quarter, and treat any vendor claim about "post-NEM 3.0 pricing" as an estimate until they show data.
How do Texas, Florida and Arizona compare?
Texas, Florida and Arizona are high-volume, mid-price solar lead markets. LeadGen Economy lists Texas and Florida at $100 to $175 per lead and Arizona at $80 to $150 (April 2026). SolarReviews puts lead cost per sale at $557 for Texas, $488 for Florida and $613 for Arizona, well below California and the Northeast.
Texas
Texas has deregulated electricity in much of the state, with retail plans that change export compensation by provider, and a large, fast-growing housing stock. Sun is strong and installer numbers are high. Volume is plentiful, so the competition question is about shared leads: in big Texas metros, a shared lead may be called by several companies within minutes. Expect price per lead in the middle of the national range and cost per sale that depends heavily on speed to lead.
Florida
Florida combines strong sun, a large owner-occupied housing base and hurricane-season interest in backup power. It is also known for aggressive door-to-door and telemarketing competition, which makes homeowners cautious. Lead quality and consent records matter. Our residential solar leads include a timestamped consent record whose disclosure names your company, available on request.
Arizona
Arizona has strong sun and established solar demand, with utility-specific export rules that changed over the past decade. SolarReviews lists Arizona at $613 per sale (defined source) and $833 (lower-quality source), a wider gap than Texas or Florida, which suggests lead source quality matters more there.
Competition in these three markets
High-volume markets reward teams that are fast and well-staffed. If you can call every lead within a minute, shared leads in these states may give you a competitive cost per sale. If you cannot, exclusive leads protect you from losing contacts to faster competitors.
Why are Northeast solar leads so expensive?
Massachusetts, New Jersey, New York and Connecticut are premium solar lead markets because electricity rates are high, state incentive programs are strong, and job values support large acquisition budgets. LeadGen Economy lists Massachusetts at $150 to $275 per lead and New York at $150 to $250. SolarReviews puts lead cost per sale at $1,286 to $1,400 for all four states.
State notes
- Massachusetts: $150 to $275 per lead (LeadGen Economy); $1,400 per sale defined source, $2,500 lower-quality (SolarReviews). The gap between quality tiers is one of the widest in the table.
- New Jersey: $100 to $175 per lead; $1,400 and $2,500 per sale.
- New York: $150 to $250 per lead; $1,357 and $2,633 per sale.
- Connecticut: $100 to $175 per lead; $1,286 and $2,667 per sale.
- Maryland and D.C. also sit high in SolarReviews ($1,333 and $900 per sale on defined sources). LeadGen Economy does not list Maryland or D.C.
What the quality gap tells you
In the Northeast, SolarReviews' lower-quality column is close to double the defined-source column. That spread suggests a poor source is especially expensive in these states. When the job is worth more, every wasted appointment costs more too. If you buy in the Northeast, ask harder questions about lead source and consent, and run smaller test batches before scaling.
Where are solar leads cheapest?
Solar leads are cheapest in the Dakotas, West Virginia, Wyoming and much of the Midwest and Mountain West, where LeadGen Economy lists per-lead ranges from $15 to about $60. SolarReviews puts North Dakota at $225 per sale and most Midwest states at about $360. Low prices reflect lower electricity rates, weaker incentives and fewer competing installers.
The cheap-lead trap
A cheap lead in a market where solar barely pays back is cheap for a reason. LeadGen Economy describes the lowest tier (including North Dakota, South Dakota, Wyoming and parts of Appalachia) as "generally unprofitable" for lead generation. Fewer homeowners have a compelling savings case, so close rates fall, and the low price per lead may not produce a low cost per sale.
When low-cost markets work
- You already operate there and have crews with spare capacity.
- Your offer fits local conditions, such as backup power for rural homes or agricultural and small commercial work.
- You have little competition, so exclusive or even shared leads reach homeowners who have not heard three pitches already.
- Your cost structure is lower, so a smaller job value still leaves margin.
What about mid-tier states like Colorado, Utah and the Carolinas?
Mid-tier solar lead markets such as Colorado, Utah, Nevada, the Carolinas, Illinois and Virginia sit between the premium and low-cost groups, with LeadGen Economy per-lead ranges of roughly $45 to $160 (April 2026). These states often combine moderate prices with less saturated competition, which makes them common candidates for expansion tests.
State notes from the two tables
- Colorado: $90 to $160 per lead (LeadGen Economy); $557 and $725 lead cost per sale (SolarReviews). Prices sit closer to Texas than to the Mountain West.
- Utah: $45 to $80 per lead, yet SolarReviews shows $700 and $1,300 per sale, among the higher per-sale figures outside the coasts. The two sources point in different directions here, so test before trusting either.
- Nevada: $50 to $90 per lead; $483 and $600 per sale.
- North Carolina: $50 to $95 per lead; $363 and $600 per sale. South Carolina: $45 to $85 per lead; $613 and $725 per sale.
- Illinois: $50 to $90 per lead; $360 and $400 per sale.
- Virginia: $50 to $90 per lead; $360 and $667 per sale.
- Pacific Northwest: Oregon $45 to $75 and Washington $40 to $70 per lead; SolarReviews lists $414 and $483 per sale on defined sources.
Why these markets are worth a test
Mid-tier states often have growing installer bases rather than saturated ones, so shared leads face fewer competing callers and exclusive leads cost less than in the premium states. The risk is thinner demand data: neither public table explains how many leads its state ranges are based on, and small markets swing more from month to month. Where the per-lead and per-sale tables disagree, as in Utah, the disagreement itself is a reason to buy a small batch and measure rather than extrapolate.
Questions to ask a vendor in a mid-tier state
- How many leads per week can my ZIP list realistically supply?
- How many other buyers do you have in these ZIPs today?
- What qualifying questions do you ask that reflect local utility rules?
- Can I start with a capped test batch and pause without penalty?
How should you compare states by cost per sale?
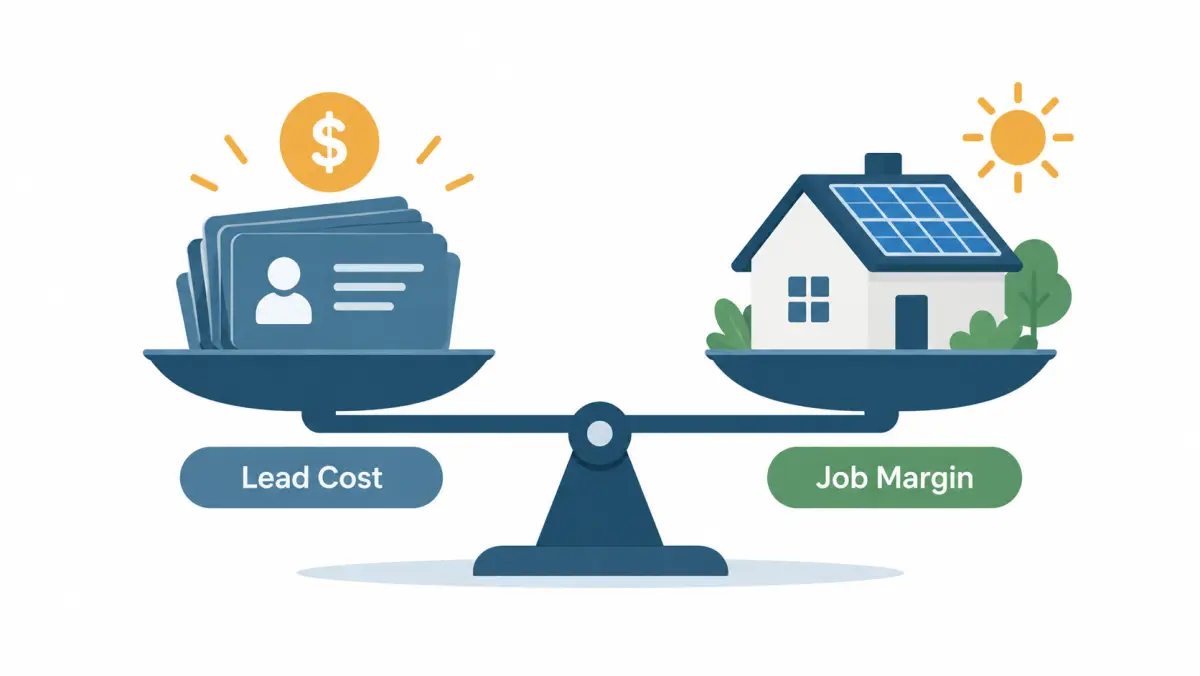
Compare states by dividing lead cost per sale by gross margin per job. A state where leads cost twice as much can be the better market if close rates and job values are high enough. Price per lead alone cannot rank markets; you need contact, appointment, sit and close rates plus margin for each state you consider.
Job value and margin by state
Job value depends on system size, price per watt, battery attach and financing type. Gross margin depends on your equipment cost, labor rates, permitting and interconnection costs, and sales commissions. Public price-per-watt data such as Lawrence Berkeley National Laboratory's Tracking the Sun shows installed prices vary meaningfully by state. Use your own contracts for margin; national averages will not tell you what you keep in a given market.
Worked example: two states
Illustrative example. Every input below is hypothetical, chosen to show the method. The per-lead prices sit inside the LeadGen Economy ranges for each state but are not quotes, and the funnel rates and margins are not benchmarks.
| Input | State A (premium market) | State B (mid-price market) |
|---|---|---|
| Price per exclusive lead | $250 | $120 |
| Contact rate | 65% | 65% |
| Appointment set rate | 35% | 35% |
| Sit rate | 75% | 70% |
| Close rate (of sits) | 30% | 22% |
| Lead-to-sale rate | 5.12% | 3.50% |
| Lead cost per sale | $4,884 | $3,425 |
| Gross margin per job (before lead cost) | $14,000 | $8,000 |
| Lead cost as share of margin | 35% | 43% |
| Margin left after lead cost | $9,116 | $4,575 |
State A's leads cost more than twice as much, yet in this example it leaves twice the margin per job after lead spend and uses a smaller share of margin on acquisition. Change the margin assumption for State A to $9,000 and the answer flips: lead cost becomes 54% of margin. The method is what transfers, not the result. Run your own numbers in the solar lead cost calculator, and read the solar customer acquisition cost guide for sensitivity tables on each funnel stage.
A simple ranking formula
For each candidate market, compute:
- Expected lead cost per sale = price per lead / (contact × set × sit × close)
- Add labor cost per sale (setter and closer time)
- Divide by gross margin per job
- Rank states by that ratio, lowest first
Markets where acquisition takes under roughly a third of gross margin leave room for overhead and profit. That threshold is a planning rule of thumb, not a benchmark; set your own based on overhead.
How do you pick states to test?
Pick test states by scoring each candidate on job value, competition, your operating capacity and compliance comfort, then test two or three markets at once with enough leads to produce 15 to 25 appointments each. Judge on cost per sat appointment first and cost per sale once deals close.
Pilot selection rubric
| Criterion | What a 5 looks like | What a 1 looks like |
|---|---|---|
| Job value and margin | Your margin per job is well above company average | Margin is thin after permitting and labor |
| Crew capacity | Crews can install within your standard timeline | You would need to subcontract or hire |
| Competition | Few installers advertise in your ZIPs | Saturated metro with national brands |
| Offer fit | Your financing and storage options fit local rules | Your offer is weak under local export rules |
| Licensing and compliance | Licensed, insured, familiar with state telemarketing rules | New state, rules unknown; confirm with counsel |
| Sales coverage | Closers live in or near the territory | Every appointment is a long drive or virtual only |
Territory sizing
A territory needs enough eligible homeowners to supply the volume you want without stretching your crews across a huge area. Start with the ZIP codes your crews already reach in a normal day. Expand outward in rings once the core ZIPs show a workable cost per appointment. Vendors can usually tell you how much volume a ZIP list can supply; territory availability for our programs is confirmed by ZIP code on your call.
Running the test
- Buy the same lead type in each test state, so you are comparing markets, not products.
- Use the same scripts, call cadence and closers where possible.
- Track every lead in your CRM with a source and state field.
- Review weekly: contact rate, appointment rate, sit rate.
- Review at 60 to 90 days: close rate and cost per sale.
- Scale the winner; pause or change the lead type in the loser.
When you have a shortlist of ZIP codes, book a call to check availability and get pricing for each territory.
Which state policy changes should lead buyers watch?
Lead buyers should watch state net metering decisions, state rebate and incentive programs, utility rate cases and changes to state telemarketing rules. Each one changes either how many homeowners want solar or how you are allowed to contact them, and both move cost per sale.
After the federal 25D credit
The federal residential credit under Section 25D ended for systems placed in service after December 31, 2025, according to the IRS. That removed a 30% credit for cash and loan buyers in every state at once. State incentives now carry more weight in the savings math, so states with strong programs may hold demand better than states without. Third-party ownership has different federal rules; talk to your tax advisor about specific projects. More context is in our guide to the post-25D solar market.
What to monitor
- Net metering or net billing proceedings at your state utility commission
- Utility rate increases, which strengthen the savings case
- State and utility rebate programs, including battery incentives
- State "mini-TCPA" telemarketing laws, which may add rules beyond federal ones. Confirm with counsel. Our guide on TCPA rules for solar lead buyers covers the federal side.
- Changes in your own close rate quarter over quarter, which often show policy effects before any public report does
How do electricity rates compare across the major solar states?
Residential electricity prices in the major solar states range from under 13 cents per kWh in Nevada to 48 cents in Hawaii, according to preliminary July 2026 figures in the EIA's Electric Power Monthly. Rates explain a large share of lead cost differences, because a higher utility bill means a bigger savings pitch and a larger job value per sale.
The table below pulls the residential average retail price for the states profiled later in this guide. The source is the US Energy Information Administration, Electric Power Monthly, Table 5.6.A, which reports average retail price by state and sector. EIA labels recent months as preliminary estimates, so treat the second decimal as noise and the ranking as the signal.
| State | July 2026 | July 2025 | Cost per lead range (LeadGen Economy, Apr 2026) |
|---|---|---|---|
| US total | 18.31 | 17.45 | n/a |
| Hawaii | 48.00 | 39.36 | $200 to $350+ |
| California | 33.61 | 32.66 | $175 to $300+ |
| Massachusetts | 30.49 | 30.07 | $150 to $275 |
| New York | 29.90 | 26.22 | $150 to $250 |
| New Jersey | 25.19 | 25.32 | $100 to $175 |
| Connecticut | 24.16 | 27.60 | $100 to $175 |
| Pennsylvania | 21.72 | 19.51 | $50 to $90 |
| Maryland | 21.41 | 18.83 | not listed |
| Illinois | 19.22 | 17.22 | $50 to $90 |
| Virginia | 17.55 | 15.78 | $50 to $90 |
| Colorado | 17.00 | 15.99 | $90 to $160 |
| Georgia | 16.27 | 15.56 | $45 to $85 |
| Texas | 15.88 | 15.36 | $100 to $175 |
| South Carolina | 15.47 | 14.70 | $45 to $85 |
| Arizona | 15.38 | 15.34 | $80 to $150 |
| North Carolina | 15.16 | 13.37 | $50 to $95 |
| Florida | 15.03 | 15.11 | $100 to $175 |
| North Dakota | 13.41 | 13.31 | $15 to $35 |
| Utah | 13.12 | 13.45 | $45 to $80 |
| Nevada | 12.77 | 12.39 | $50 to $90 |
Rate source: EIA Electric Power Monthly, Table 5.6.A, July 2026 vs July 2025, preliminary. Lead price source: LeadGen Economy state table, updated April 21, 2026. July is a single summer month; annual averages differ. Neither column is our pricing.
What the rate table does and does not explain
Rates line up well with lead prices at the top of the table. Hawaii, California, Massachusetts and New York lead both columns. The match breaks down in the middle. Texas, Florida and Arizona all have residential rates below the national average in this snapshot, yet their per-lead ranges sit well above Pennsylvania and Illinois, which have higher rates. The reasons are volume and competition. Sun Belt states have more roof-hours of sun per year, so a kilowatt of panels produces more energy, and they have large installer populations bidding for the same homeowners. A lead price is set by what buyers will pay, and in a crowded market buyers bid up the price even when the per-kWh savings case is weaker.
So use rates as one input, not the answer. The state profiles below add the other inputs: how exports are credited, which incentives remain after the federal 25D credit ended, who the utilities are, and how crowded the installer field is.
Rate trend matters as much as the rate
A state whose rates rose sharply year over year gives your reps a fresh reason to call. In this EIA snapshot New York, Maryland, Pennsylvania, Illinois, Virginia and North Carolina all show residential rates up roughly 9 to 14 percent from July 2025 to July 2026, while Florida, New Jersey and Utah were flat or slightly down and Connecticut fell. Homeowners notice the bill, not the cents per kWh. A rate jump tends to lift inbound interest, which can lower the cost to produce a lead for a while before vendors and competing installers catch up. If you buy in a state where rates just jumped, test early, and watch whether your contact and appointment rates rise with the news cycle.
How to read the state profiles in this guide
Each state profile below covers the same five items in the same order: export compensation (net metering or its replacement), remaining state incentives, the main utilities and regulator, competitive pressure on leads, and what the published lead prices from our two sources say. Every policy point links to the state regulator, a program page, or DSIRE so you can check it yourself.
The Database of State Incentives for Renewables and Efficiency (DSIRE), run by the NC Clean Energy Technology Center, is the best single starting point for state policy. It lists net metering rules, tax credits, rebates and performance incentives by state and utility. Policy changes faster than any guide, so for anything you plan to put in a sales script, confirm against the regulator's own docket or the program administrator's site before your reps say it on the phone.
The profile template
| Item | What we look at | Why it moves lead cost |
|---|---|---|
| Export compensation | Retail net metering, net billing, export rate, or buy-all tariff | Sets how fast solar pays back, which sets homeowner interest and close rate |
| State incentives | Tax credits, rebates, performance payments, storage programs | Fills part of the gap left by the end of 25D for cash and loan buyers |
| Utilities and regulator | Investor-owned utilities vs munis and co-ops; the PUC that sets rules | Rules can differ by utility inside one state, so ZIP filters matter |
| Competition | Installer density, door-to-door activity, shared lead resale | Drives price per lead and the share of leads already talked to |
| Published lead prices | LeadGen Economy per-lead range; SolarReviews cost per sale | The only attributed state price data we could verify |
Labels used below
- Confirmed: the point links to a regulator, statute, program administrator or DSIRE page.
- : a detail we could not confirm against a primary source on the date of writing. These notes are for the site owner and are stripped from the rendered page. Treat any such point as unconfirmed.
- Illustrative example: a worked calculation with assumed inputs. These are not market data and not our prices.
California: what drives solar lead cost in the most expensive large market?
California solar leads cost $175 to $300+ per lead according to LeadGen Economy (April 2026), and SolarReviews reports $1,929 lead cost per sale on defined sources. The drivers are the highest residential rates of any mainland state, net billing that rewards batteries, and the densest installer field in the country.
Export compensation
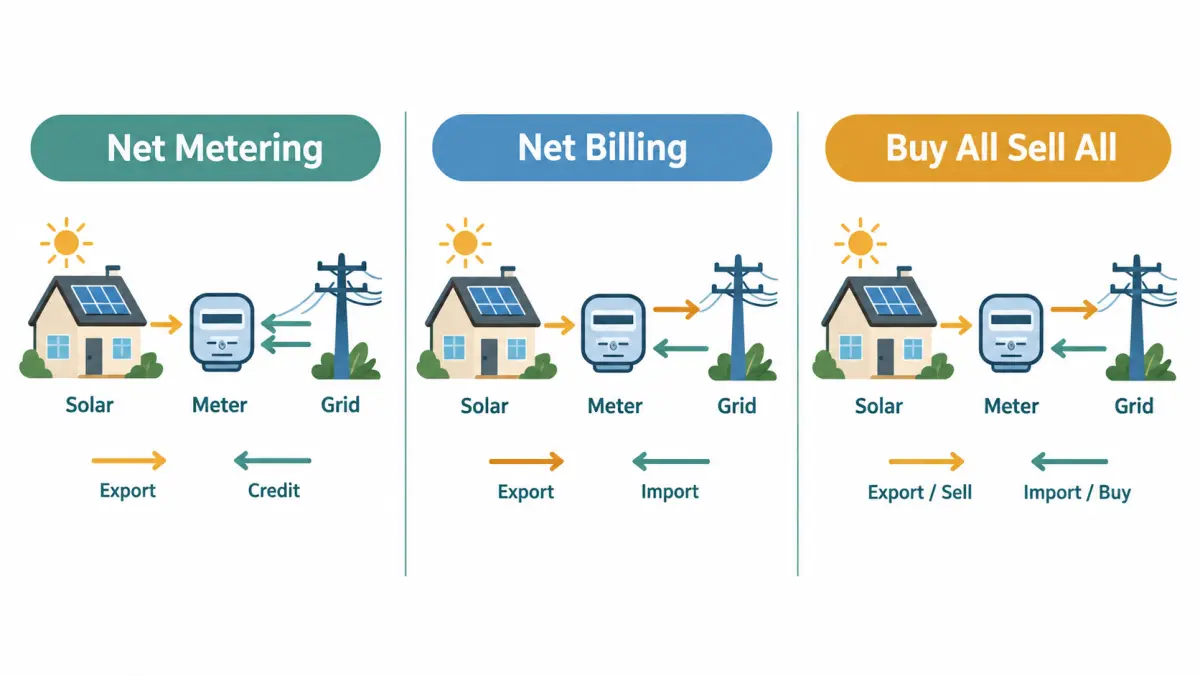
New customers of the three large investor-owned utilities, Pacific Gas and Electric, Southern California Edison and San Diego Gas & Electric, take service under the Net Billing Tariff if they applied to interconnect on or after April 15, 2023. The CPUC adopted it in Decision 22-12-056. Under net billing, power you use on site still offsets retail rates, but exported energy is credited at values from the CPUC's Avoided Cost Calculator, which vary by hour and are much lower than retail for most of the day. Details are on the CPUC's net billing tariff page.
Practical effect for a lead buyer: a solar-only system sized to export a lot of midday energy pays back more slowly than it did under NEM 2.0. Systems that pair panels with a battery, store the midday surplus and discharge it in the evening peak recover much of the lost value. That is why California sales have shifted toward solar-plus-storage and why lead filters for battery interest carry a premium there.
Customers who were already on NEM 1.0 or NEM 2.0 keep their tariff for 20 years from their original interconnection date under CPUC rules. Those homeowners are not new-system prospects, but some are expansion or battery-retrofit prospects, which is a separate lead category worth asking vendors about.
Municipal utilities follow their own rules
Not every California homeowner is on an IOU. The Los Angeles Department of Water and Power, the Sacramento Municipal Utility District and other public utilities set their own export rules and rate designs, which the CPUC does not regulate. Rates are often lower than the IOUs, so the savings case differs. If you buy leads in Los Angeles or Sacramento, ask your vendor whether it can filter by utility, and price the two groups separately in your cost-per-sale math.
Incentives that remain
- Self-Generation Incentive Program (SGIP): the CPUC's storage incentive, with budgets reserved for equity and resiliency customers. Funding moves in steps and some steps close quickly. Program details are on the CPUC SGIP page.
- Property tax: California has excluded qualifying active solar energy systems from property tax reassessment under Revenue and Taxation Code section 73.
- Federal: the residential Section 25D credit ended for systems placed in service after December 31, 2025 (see the IRS link in our sources). Third-party-owned systems are handled under different federal rules; confirm specifics with a tax advisor.
Rate design changes to watch
The CPUC adopted an income-graduated fixed charge for IOU residential customers in 2024, which lowers per-kWh energy charges somewhat while adding a fixed monthly amount. Lower volumetric rates trim the per-kWh savings from solar and storage at the margin. Your reps should be ready to explain this because competitors and homeowners will raise it.
Competition
California has the largest installed base of residential solar in the country and the largest number of installers, from national brands to one-truck local crews. Homeowners in established solar neighborhoods have been canvassed, cold-called and sent mailers for years. That raises the cost to produce a fresh lead and lowers the contact rate on shared leads. The gap in SolarReviews' columns, $1,929 per sale on defined sources versus $3,167 on lower-quality sources, is the widest dollar gap in its table. Source quality matters more in California than anywhere else.
California buying checklist
- Ask whether the vendor can filter by IOU vs municipal utility.
- Ask whether battery interest is a captured field and how it is asked.
- Ask for the consent record format and the disclosure language that names your company.
- Run a separate cost-per-sale model for solar-only and solar-plus-storage, because job value and close rate differ.
- Start with a small batch in two or three ZIP clusters, not the whole state.
- Track the share of leads who say they already have quotes. In California that share is often high and it predicts your close rate.
Illustrative example: California solar-plus-storage math
Illustrative example with assumed inputs, not market data and not our pricing. Suppose a team pays $250 per exclusive lead, contacts 70 percent, sets appointments with 35 percent of contacts, sits 80 percent of appointments and closes 30 percent of sits.
- Leads per sale: 1 ÷ (0.70 × 0.35 × 0.80 × 0.30) = 1 ÷ 0.0588 = about 17 leads.
- Lead cost per sale: 17 × $250 = $4,250.
- If the average solar-plus-storage contract yields $9,000 of gross margin after equipment, labor and commission, lead cost takes about 47 percent of margin. That is high but may be workable if the rest of the overhead is lean.
- If the same team sold mostly solar-only jobs at $4,500 of gross margin, lead cost would take 94 percent of margin. The state is the same; the product mix decides the outcome.
Use the solar lead cost calculator to rerun this with your own rates.
Texas: why are Texas solar leads priced mid-to-high despite lower electricity rates?
Texas solar leads cost $100 to $175 per lead according to LeadGen Economy (April 2026), with SolarReviews reporting $557 lead cost per sale on defined sources. Residential rates are below the national average, but strong sun, fast housing growth, grid-reliability worries and heavy installer competition keep lead prices in the upper-middle tier.
Export compensation varies by provider, not by state rule
Texas has no statewide net metering requirement. In the parts of the state open to retail competition, homeowners buy power from a retail electric provider, and each provider decides whether and how to credit solar exports. Some offer buyback plans; some credit at a fraction of retail; some offer nothing. The wires company (for example Oncor, CenterPoint, AEP Texas or TNMP) handles interconnection, but the export credit is a retail plan feature. The Public Utility Commission of Texas oversees the market, and the state's Power to Choose site lists plans.
Outside the competitive market, municipal utilities and co-ops set their own terms. Austin Energy has used a value-of-solar credit, and CPS Energy in San Antonio has run solar rebates. El Paso Electric, Entergy Texas, Xcel's Southwestern Public Service and dozens of electric co-ops each have their own rules.
What this means for lead cost: a Texas lead's value depends on the homeowner's provider and plan. A homeowner on a plan with a decent buyback credit is a better prospect than one on a plan that pays nothing for exports. Smart Texas buyers ask vendors to capture utility or provider name, and train reps to ask about it in the first call.
Incentives that remain
- Property tax exemption: Texas Tax Code section 11.27 exempts the added value of a solar energy device from property tax. This is a durable, statewide talking point.
- HOA protections: Texas Property Code section 202.010 limits homeowner associations' ability to ban solar installations, with listed exceptions. Useful for reps when a prospect says their HOA won't allow panels.
- Utility rebates: some munis and co-ops offer rebates; the list changes. Check DSIRE by ZIP.
- No statewide tax credit: Texas has no state income tax, so there is no state solar tax credit to replace 25D.
Reliability is a sales driver
The February 2021 winter storm, often called Winter Storm Uri, caused extended outages across the ERCOT grid. Since then, backup power has been a recurring reason Texans ask about solar and batteries. That interest is real but uneven. It spikes after weather events and fades in mild seasons. Lead vendors that run ads tied to outage news will see cost per lead fall during spikes, and some of that shows up in buyer pricing. Plan your Texas budget with seasonality in mind.
Competition
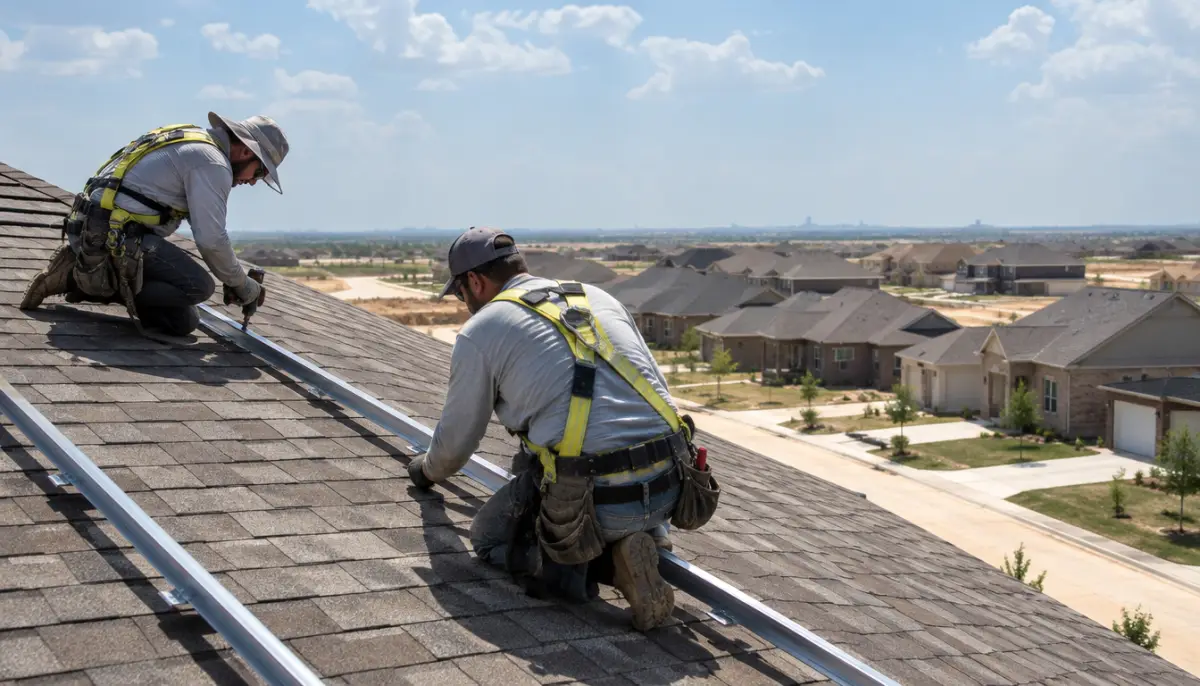
Texas metros, especially Houston, Dallas-Fort Worth, San Antonio and Austin, have large installer populations and an active door-to-door presence. New-build subdivisions attract canvassers within months of move-in. Shared leads in these metros are often called by several companies within minutes. The SolarReviews spread is modest, $557 defined versus $633 lower-quality, which suggests that in Texas the big cost risk is speed and competition more than source quality.
Texas buying checklist
- Capture utility or retail provider at intake, or ask on the first call.
- Separate competitive-market ZIPs from muni and co-op ZIPs in reporting.
- Prepare a buyback-plan script: reps should explain that the homeowner may want to switch to a plan that credits exports, and that plan terms change.
- Staff for speed. In big Texas metros, a lead not called in five minutes is a lead someone else called first. See solar speed to lead.
- Track lead cost per sale by metro, not statewide. Houston and El Paso are different markets.
Illustrative example: Texas shared vs exclusive
Illustrative example with assumed inputs. Team A buys shared leads at $60 and exclusive leads at $140 in a Dallas suburb.
| Metric | Shared (assumed) | Exclusive (assumed) |
|---|---|---|
| Price per lead | $60 | $140 |
| Contact rate | 45% | 70% |
| Appointment rate of contacts | 25% | 35% |
| Sit rate | 70% | 80% |
| Close rate of sits | 20% | 28% |
| Leads per sale | 63.5 | 18.2 |
| Lead cost per sale | about $3,810 | about $2,550 |
In this example the shared lead is cheaper per lead but more expensive per sale, because three or four installers are calling the same person. A team that calls within 60 seconds and has a strong closer could narrow that gap. The comparison is covered in depth in exclusive vs shared solar leads.
Florida: what shapes solar lead cost in the Sunshine State?
Florida solar leads cost $100 to $175 per lead according to LeadGen Economy (April 2026), and SolarReviews lists $488 lead cost per sale on defined sources. Florida keeps retail net metering for investor-owned utility customers, strong sun and hurricane-driven backup demand, offset by moderate rates and very heavy telemarketing and door-to-door competition.
Export compensation
Florida's net metering rule, Florida Administrative Code Rule 25-6.065, requires the state's investor-owned utilities, including Florida Power & Light, Duke Energy Florida and Tampa Electric, to offer net metering to customer-owned renewable systems. Excess generation is credited at retail on the next bill and carried forward month to month; unused credits are paid out at year end at the utility's as-available energy rate. The Florida Public Service Commission administers the rule.
In 2022 the Legislature passed House Bill 741, which would have phased down net metering credits. Governor DeSantis vetoed it in April 2022, so retail net metering for IOU customers remained. Bills on the topic can return in any session.
Municipal utilities such as JEA in Jacksonville and the Orlando Utilities Commission, and the state's rural electric co-ops, set their own net metering terms. Some are less generous than the IOU rule. Ask vendors whether they can filter by utility.
Incentives that remain
- Sales tax exemption: Florida Statutes section 212.08(7)(hh) exempts solar energy systems from state sales tax.
- Property assessment exclusion: Florida Statutes section 193.624 excludes the added value of residential renewable energy property from property tax assessment.
- Solar rights: Florida Statutes section 163.04 limits HOA and deed restrictions that would prohibit solar collectors, while allowing associations to set placement rules within limits. This matters in a state full of HOA communities.
- No state income tax: so no state tax credit to replace 25D.
Hurricanes and backup demand
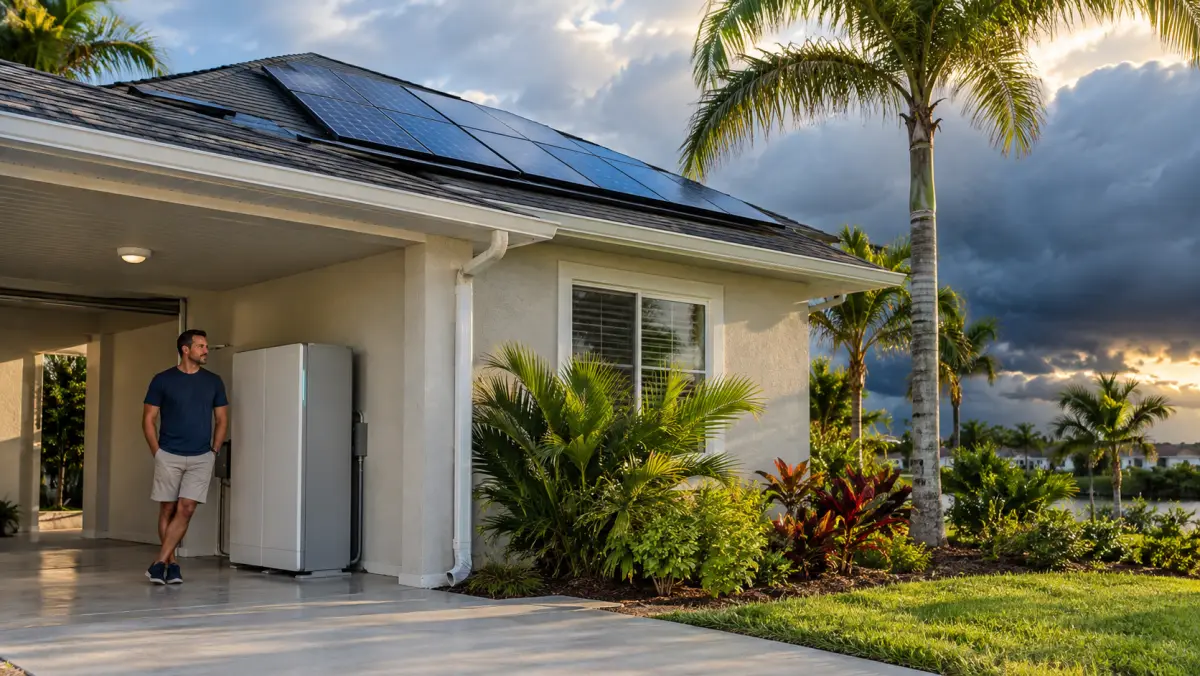
Florida's hurricane season runs June 1 to November 30. Each major storm brings outages, and outages bring inquiries about batteries and generators. That makes Florida lead volume seasonal and event-driven. A vendor running storm-season campaigns may produce more leads at lower cost for a few weeks, followed by a drop-off. Homeowners in storm-prone counties also face roof-condition and insurance questions; reps should be ready for "my insurer wants a new roof first" and "will panels affect my wind coverage." Confirm insurance answers with the homeowner's carrier; do not let reps improvise.
Competition and consumer caution
Florida is one of the most heavily canvassed solar states. Homeowners have been called, texted and door-knocked repeatedly, and many are wary. That pushes up the share of leads who do not answer unknown numbers and raises the value of a clean consent record that names your company. SolarReviews' spread is narrow, $488 defined versus $550 lower-quality, so like Texas, Florida's cost risk is more about contact rate and trust than about the vendor's source alone.
Florida buying checklist
- Confirm the utility. IOU net metering and muni or co-op terms differ.
- Prepare roof-age and insurance questions for the first call.
- Set a storm-season budget plan: more capacity June to November, with a reserve for post-storm spikes.
- Ask for the consent record and confirm it names your business. Florida also has its own telemarketing law; confirm calling rules with counsel. Our TCPA compliance guide covers the federal layer.
- Expect lower contact rates than in less-canvassed states and staff text follow-up accordingly.
Arizona: how do export rates and utility type change Arizona lead value?
Arizona solar leads cost $80 to $150 per lead according to LeadGen Economy (April 2026); SolarReviews lists $613 per sale on defined sources and $833 on lower-quality sources. Arizona has excellent sun, but export credits for new customers have stepped down since 2017, and rules differ sharply between APS and TEP customers and SRP customers.
Export compensation
In 2017 the Arizona Corporation Commission ended retail net metering for new rooftop solar customers of the utilities it regulates, mainly Arizona Public Service and Tucson Electric Power, and replaced it with an export rate based on a Resource Comparison Proxy (Decision 75859). Exported energy is credited at a set export rate that can step down by up to 10 percent a year as installations grow, and a customer locks in the export rate in effect when they interconnect for a fixed period. The Arizona Corporation Commission dockets hold the current values.
Salt River Project, which serves much of the Phoenix metro area, is a public power entity not regulated by the ACC. SRP sets its own price plans for solar customers, and some of them have included demand charges. Demand charges change the savings math and make batteries more attractive.
For a lead buyer, this means two homeowners on the same Phoenix street can have different savings cases depending on whether they are APS or SRP customers. Utility capture is not optional in Arizona.
Incentives that remain
- State tax credit: Arizona offers a residential solar energy credit of 25 percent of system cost, capped at $1,000, under Arizona Revised Statutes section 43-1083. Small, but a real state incentive in a post-25D world.
- Sales and property tax: Arizona has exempted qualifying solar equipment from transaction privilege tax and excluded it from property valuation.
Competition
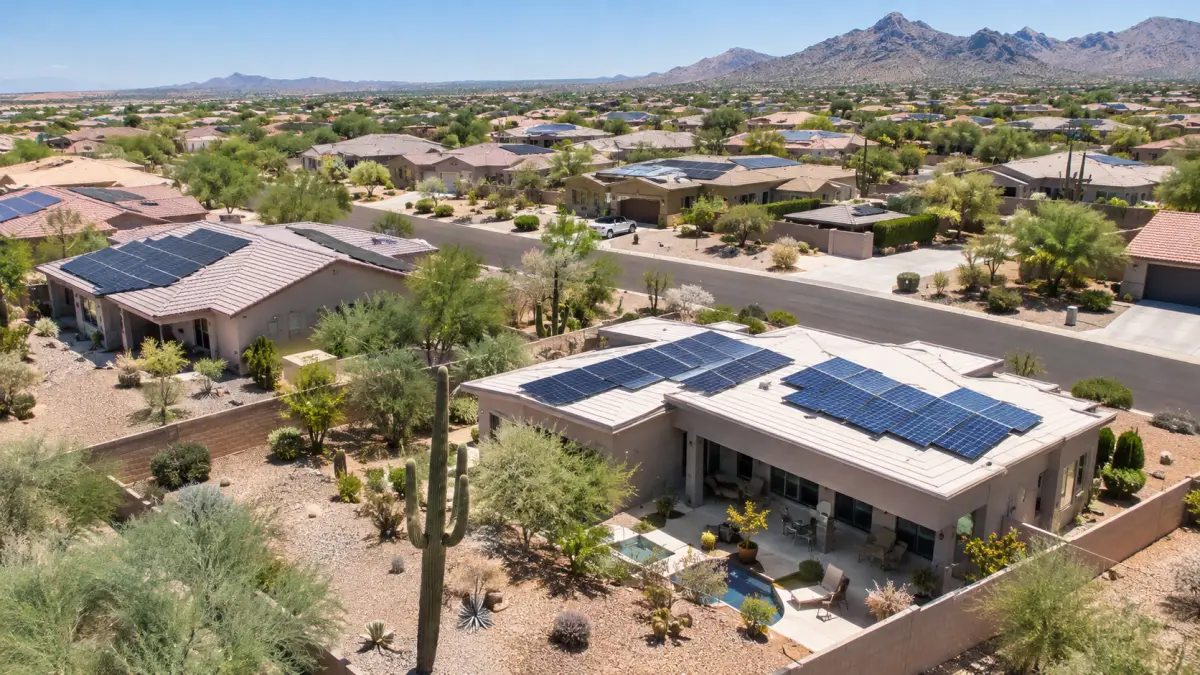
Phoenix and Tucson have long-established installer markets and a heavy door-to-door presence in newer subdivisions. Arizona's SolarReviews spread is wider than Texas or Florida, $613 versus $833, which suggests the quality of the lead source matters more there. A vendor that cannot filter by utility or that resells leads to several buyers is likely to cost you more per sale in Arizona.
Arizona buying checklist
- Capture APS, TEP or SRP at intake.
- Build separate scripts for export-rate customers and demand-charge customers.
- Expect battery interest to matter more for SRP leads.
- Ask the vendor how many buyers receive each lead, and test exclusive leads first in Phoenix suburbs.
- Summer heat drives bill shock. Budget for higher volume in late spring and summer.
Nevada: why are Nevada leads cheaper than their sun suggests?
Nevada solar leads cost $50 to $90 per lead according to LeadGen Economy (April 2026); SolarReviews lists $483 per sale on defined sources. Nevada has some of the strongest sun in the country, but residential rates were the lowest of the states in our EIA table, and export credits are below retail, which narrows the savings case.
Export compensation
Nevada's net metering history is a cautionary tale for lead buyers. In late 2015 the Public Utilities Commission of Nevada approved changes that sharply cut export value, the market contracted, and in 2017 the Legislature passed Assembly Bill 405, which restored net metering with credits that stepped down in tranches to a floor of 75 percent of the retail rate. New NV Energy customers today receive credits at that floor. Details are with the Public Utilities Commission of Nevada.
Lesson for buyers: a policy change can change a state's lead economics within months. The 2015 to 2017 period showed what happens when a state's savings case drops quickly. Buyers who had locked into long volume commitments were exposed. Keep state commitments short. Our offer has no long-term contracts; territory availability is confirmed by ZIP on your call.
Market notes
Most of Nevada's population is in the Las Vegas and Reno metro areas, both served by NV Energy. That makes Nevada simple to filter. Rates in our EIA snapshot were 12.77 cents per kWh, below the national average, so savings pitches lean on long-term rate increases and on summer bills driven by air conditioning rather than on cents per kWh.
Nevada buying checklist
- Lead with summer bill size, not per-kWh rates.
- Explain that exports earn less than retail and size systems for self-consumption.
- Battery interest is moderate; test it as a filter rather than a requirement.
- Keep volume commitments short given the state's policy history.
Illustrative example: Nevada self-consumption math
Illustrative example with assumed inputs, not market data and not our pricing. A Las Vegas team pays $80 per exclusive lead, contacts 65 percent, sets appointments with 30 percent of contacts, sits 80 percent and closes 25 percent of sits.
- Leads per sale: 1 ÷ (0.65 × 0.30 × 0.80 × 0.25) = 1 ÷ 0.039 = about 25.6 leads.
- Lead cost per sale: 25.6 × $80 = about $2,050.
- If gross margin per job is $5,000, lead cost takes about 41 percent of margin.
The low per-lead price does not guarantee a low cost per sale. Because exports earn less than retail, homeowners who use most of their power in the afternoon and evening, for example households with pools or electric vehicles, tend to have a stronger case. Asking about pool pumps, EV charging and summer bill size on the first call helps reps spend time on the right homeowners.
Utah: how does net billing shape lead economics?
Utah solar leads cost $45 to $80 per lead according to LeadGen Economy (April 2026), but SolarReviews lists $700 per sale on defined sources and $1,300 on lower-quality sources, one of the higher per-sale figures outside the coasts. Low residential rates and an export credit below retail make conversion harder.
Export compensation
Rocky Mountain Power, the main investor-owned utility, moved new rooftop solar customers off retail net metering after a 2017 settlement. The Public Service Commission of Utah later set an export credit rate for new customers, with exports measured over short intervals and credited at a value below retail. Utah's state renewable energy tax credit for residential solar was phased down and has expired for new systems.
Why cost per sale is high here
Utah combines low rates (13.12 cents per kWh in our EIA snapshot), below-retail export credits and an experienced, heavily canvassed homeowner base. Utah has long been a home market for door-to-door solar sales teams. The cheap per-lead price does not translate into cheap sales, which is what SolarReviews' per-sale column shows. This is the clearest example in the table of a state where per-lead price and cost per sale tell opposite stories.
Utah buying checklist
- Model cost per sale before buying. Do not let a low per-lead price set the budget.
- Ask how many times the homeowner has been contacted by solar companies.
- Pitch batteries and self-consumption rather than exports.
- Test with a small batch and a strict stop rule.
Colorado: what makes Colorado a mid-price market with steady demand?
Colorado solar leads cost $90 to $160 per lead according to LeadGen Economy (April 2026); SolarReviews lists $557 per sale on defined sources and $725 on lower-quality ones. Colorado combines good sun, retail net metering at Xcel Energy, rising rates and educated buyers.
Export compensation
Colorado law requires investor-owned utilities to offer net metering, and Xcel Energy Colorado, the largest utility, credits excess generation at retail with carryover. The Colorado Public Utilities Commission oversees Xcel; municipal utilities and co-ops, including large ones along the Front Range, set their own rules.
Incentives and rates
Colorado residential rates were 17.00 cents per kWh in July 2026 per EIA, up from 15.99 a year earlier. Xcel has offered solar and battery programs under its Solar*Rewards and storage offerings at various times. Colorado has also exempted residential solar from state sales tax. Check DSIRE for local utility rebates, which are common in Front Range cities.
Market notes
Denver, Boulder, Fort Collins and Colorado Springs have different utilities, from Xcel to municipal systems like Colorado Springs Utilities and Fort Collins Utilities. Hail is a recurring roof issue, so reps will field questions about panel durability and roof replacement timing. Buyers tend to research before calling back, which favors teams with good follow-up content.
Colorado buying checklist
- Separate Xcel ZIPs from muni and co-op ZIPs.
- Prepare hail and roof-age answers.
- Use email and text follow-up with real information; Colorado buyers compare.
- Test battery-interest filters, especially in mountain areas where outages are more common.
New York: how do NY-Sun and high rates shape lead cost?
New York solar leads cost $150 to $250 per lead according to LeadGen Economy (April 2026); SolarReviews lists $1,357 per sale on defined sources and $2,633 on lower-quality ones. High and rising rates, a state tax credit, NY-Sun incentives and dense metro competition put New York in the premium tier.
Export compensation
Residential solar customers in New York's investor-owned utility territories have kept net metering, but under a 2020 order from the New York Public Service Commission, mass-market customers who interconnect on or after January 1, 2022 pay a monthly Customer Benefit Contribution charge based on system size. The charge funds public benefit programs that net metered customers would otherwise avoid paying through their usage.
Long Island is different. PSEG Long Island operates the grid on behalf of the Long Island Power Authority, and LIPA sets its own tariffs. Municipal utilities upstate also have their own rules. Utility capture matters.
Incentives that remain
- NY-Sun: NYSERDA's NY-Sun program pays incentives per watt through declining Megawatt Blocks by region. Con Edison territory and the rest of the state have separate blocks. Check the current block before quoting.
- State income tax credit: New York offers a solar energy system equipment credit of 25 percent of qualified costs, capped at $5,000, under Tax Law section 606(g-1). With 25D gone, this is one of the larger remaining state credits.
- Sales tax: residential solar equipment and installation are exempt from state sales tax, and localities can opt into the exemption too.
- Property tax: Real Property Tax Law section 487 provides a 15-year exemption for the added value, but local jurisdictions can opt out. Check by town.
Rates
EIA's preliminary July 2026 figure for New York was 29.90 cents per kWh, up from 26.22 a year earlier, one of the steepest increases among the states in our table. Rising bills tend to lift inbound interest. Con Edison customers in New York City face the highest rates in the state, but rooftop access, building type and permitting in the city make residential solar harder to close.
Market notes
New York splits into very different markets: Long Island (single-family homes, high rates, mature installer market), the Hudson Valley and Westchester (high rates, larger lots), New York City (mostly multifamily, complex permitting), and upstate (lower rates, more rural, larger roofs). A statewide per-lead price hides those differences. Buy by region.
New York buying checklist
- Separate Long Island, NYC, Hudson Valley and upstate in your test.
- Capture utility at intake (Con Edison, PSEG Long Island, National Grid, NYSEG, RG&E, Central Hudson, O&R).
- Prepare reps to explain the 25 percent state credit, the NY-Sun incentive and the CBC charge accurately.
- Watch the wide SolarReviews quality gap: in New York, a poor source can nearly double cost per sale.
New Jersey: how do SREC-II and retail net metering affect leads?
New Jersey solar leads cost $100 to $175 per lead according to LeadGen Economy (April 2026); SolarReviews lists $1,400 per sale on defined sources and $2,500 on lower-quality ones. New Jersey keeps retail net metering, pays a fixed performance incentive for new residential systems, and has one of the most mature, crowded solar markets in the East.
Export compensation and incentives
New Jersey's investor-owned utilities, including PSE&G, JCP&L, Atlantic City Electric and Rockland Electric, offer net metering with retail credit. The New Jersey Board of Public Utilities replaced the legacy SREC market with the Successor Solar Incentive Program in 2021. Under its Administratively Determined Incentive track, net metered residential systems earn SREC-IIs, each representing one megawatt-hour of generation, at a fixed value for 15 years. Program rules are on New Jersey's Clean Energy Program site.
New Jersey also exempts solar equipment from state sales tax and excludes it from property tax assessment.
Market notes
New Jersey has had residential solar programs for two decades. Many homeowners have neighbors with panels, many have received quotes, and some have legacy third-party-owned systems. Lead buyers should expect a sophisticated, comparison-shopping homeowner who knows the term "SREC." Long sales cycles are common. The SolarReviews quality gap is wide, so test sources carefully.
New Jersey buying checklist
- Train reps on SREC-II in plain language: a payment per MWh produced, fixed for 15 years.
- Ask the vendor to flag homeowners who already have solar, to avoid wasted calls or to route to expansion offers.
- Expect multiple competing quotes. Strong follow-up and clear proposals win here.
Massachusetts: why does Massachusetts sit near the top of both tables?
Massachusetts solar leads cost $150 to $275 per lead according to LeadGen Economy (April 2026), and SolarReviews lists $1,400 per sale on defined sources and $2,500 on lower-quality ones. Some of the highest rates on the mainland, retail net metering for small systems, the SMART program and a state tax credit keep Massachusetts demand and lead prices high.
Export compensation
Massachusetts offers net metering through its investor-owned utilities, Eversource, National Grid and Unitil, overseen by the Department of Public Utilities. Small residential systems are generally exempt from the state's net metering capacity caps. Massachusetts also has 41 municipal light plants that set their own terms.
Incentives that remain
- SMART: the Solar Massachusetts Renewable Target program, run by the Department of Energy Resources, pays a per-kWh incentive for a fixed term. A redesigned successor program has been rolled out; check the DOER SMART page for current residential terms.
- State tax credit: 15 percent of system cost, capped at $1,000.
- Sales and property tax: residential solar is exempt from state sales tax and from local property tax for 20 years.
- Battery programs: Mass Save's ConnectedSolutions has paid homeowners for letting utilities draw on batteries at peak times.
Market notes
Massachusetts homes are older, roofs are often steep, small or shaded, and many need replacement before solar. Expect a larger share of leads disqualified on site. Municipal light plant territories, such as Braintree or Concord, have lower rates and different rules, so filter them out or price them separately. The quality gap between SolarReviews' columns is one of the widest, so ask hard questions about source.
Massachusetts buying checklist
- Filter out or separately price municipal light plant territories.
- Ask the vendor how shade and roof age are screened, if at all, and plan for remote site assessments before sending reps out.
- Train reps on SMART, the state credit and battery programs.
- Run smaller test batches before scaling; per-lead prices are high.
Connecticut and Rhode Island: how do fixed-compensation programs change the pitch?
Connecticut solar leads cost $100 to $175 per lead and Rhode Island $90 to $150 according to LeadGen Economy (April 2026). SolarReviews lists $1,286 and $656 per sale on defined sources. Both states have high rates and run residential programs that pay a fixed compensation rate for a set period rather than classic retail net metering.
Connecticut
Connecticut replaced its legacy net metering for new residential customers with the Residential Renewable Energy Solutions program, which began in 2022. Homeowners choose between a buy-all tariff, where all production is sold to the utility at a fixed rate, and a netting tariff, where on-site use offsets the bill and net exports are paid at a fixed rate, each for a 20-year term. The program applies to Eversource and United Illuminating customers and is overseen by the Public Utilities Regulatory Authority. Connecticut's Energy Storage Solutions program, administered with the Connecticut Green Bank, offers incentives for batteries.
Connecticut rates were 24.16 cents per kWh in July 2026 per EIA, down from 27.60 a year earlier, the largest drop in our table. A falling rate can soften inbound demand in the short term; watch your contact and appointment rates.
Rhode Island
Rhode Island Energy is the main utility. The state has run net metering and a Renewable Energy Growth program with fixed long-term payments, plus Commerce RI's Renewable Energy Fund grants for small systems. Rhode Island is small, so per-state volume is small; buyers often bundle it with southeastern Massachusetts.
Buying notes for both
- Learn the fixed-compensation programs well enough to explain buy-all vs netting in two sentences.
- Battery incentives are a strong reason to pitch storage in Connecticut.
- Rhode Island volume is limited; set realistic weekly caps.
Maryland, Pennsylvania and Virginia: what drives the Mid-Atlantic?
Maryland, Pennsylvania and Virginia sit in very different places in the published data. SolarReviews lists Maryland at $1,333 per sale on defined sources, while Pennsylvania and Virginia are both $360. LeadGen Economy lists Pennsylvania and Virginia at $50 to $90 per lead and does not list Maryland. All three saw rate increases in the July 2026 EIA snapshot.
Maryland
Maryland offers retail net metering under a statewide program with a capacity cap that the Legislature has raised over time, overseen by the Maryland Public Service Commission. The Maryland Energy Administration has run a Residential Clean Energy Rebate Program, and the state has an SREC market. Rates rose from 18.83 to 21.41 cents per kWh between July 2025 and July 2026 per EIA. The high SolarReviews per-sale figure suggests a competitive market around the Baltimore-Washington corridor, where D.C. itself lists at $900 per sale.
Pennsylvania
Pennsylvania electric distribution companies, including PECO, PPL, Duquesne Light and the FirstEnergy utilities, offer retail net metering under state rules administered by the Pennsylvania Public Utility Commission. Retail supply is open to competition, so a homeowner's per-kWh price depends partly on their chosen supplier. Pennsylvania has no large statewide solar rebate. Rates jumped from 19.51 to 21.72 cents per kWh year over year per EIA, which gives reps a timely reason to call. A low per-lead range and modest per-sale figure make Pennsylvania one of the better value tests in the East.
Virginia
Dominion Energy Virginia and Appalachian Power offer net metering under the Virginia Clean Economy Act framework, with the State Corporation Commission reviewing net metering terms. The SCC has been reviewing Dominion's net metering tariff for new customers. Northern Virginia is affluent and fast-growing; southern and western Virginia are rural with co-op service.
Buying notes for the Mid-Atlantic
- Pennsylvania and Virginia are worth testing at low per-lead prices because the per-sale figures are modest.
- In Maryland, expect premium pricing and invest in speed and source quality.
- Track pending regulatory decisions in Virginia; export terms for new customers may change.

Illinois: how did the 2025 net metering change affect lead value?
Illinois solar leads cost $50 to $90 per lead according to LeadGen Economy (April 2026); SolarReviews lists $360 per sale on defined sources and $400 on lower-quality ones. Illinois Shines incentives and rising rates support demand, but new customers since January 1, 2025 receive a smaller export credit than before.
Export compensation
Under the Climate and Equitable Jobs Act of 2021, Illinois changed net metering for new customers of ComEd and Ameren Illinois. Customers who interconnected before January 1, 2025 kept full retail netting. New customers are credited for the supply portion of exported energy but not the delivery portion, and in exchange the utilities offer a distributed generation rebate tied to system size, with additional value for systems paired with smart inverters or storage. The Illinois Commerce Commission oversees the utilities.
Incentives that remain
The Illinois Shines program, the state's Adjustable Block Program, buys renewable energy credits from new systems through approved vendors, usually paid upfront to the installer and passed through to the customer as a price reduction. It is the largest remaining incentive in Illinois and the main reason Illinois economics held up after the federal credit ended. Illinois Solar for All serves income-eligible households. Block capacity opens and fills, so check current availability.
Market notes
ComEd serves Chicago and northern Illinois; Ameren Illinois serves the central and southern parts of the state. Municipal utilities and co-ops are outside the ICC rules. The Chicago suburbs are the volume center. EIA's July 2026 figure was 19.22 cents per kWh, up from 17.22. Low SolarReviews per-sale figures and moderate per-lead prices make Illinois a reasonable value test for installers who are approved Illinois Shines vendors or work with one.
Illinois buying checklist
- Confirm your company's Illinois Shines vendor status or partner before buying.
- Train reps on the supply-only credit and the DG rebate, and why batteries help.
- Capture ComEd vs Ameren at intake.

North and South Carolina: how are Duke Energy's rule changes shaping leads?
North Carolina solar leads cost $50 to $95 per lead and South Carolina $45 to $85 according to LeadGen Economy (April 2026). SolarReviews lists $363 per sale in North Carolina and $613 in South Carolina on defined sources. Both states run on Duke Energy and Dominion rate designs that now pair solar with time-of-use pricing.
North Carolina
In 2023 the North Carolina Utilities Commission approved Duke Energy's revised net metering for new residential solar customers. New customers move to time-of-use rates with critical peak pricing, a minimum bill and monthly netting, with a transitional option for early adopters. Duke has offered incentive programs, including a PowerPair pilot for solar plus battery. North Carolina rates rose from 13.37 to 15.16 cents per kWh year over year per EIA, a sharp move that gives reps a reason to call.
Electric membership co-ops serve much of rural North Carolina and set their own terms. Dominion Energy North Carolina serves the northeast corner.
South Carolina
South Carolina's Act 62 of 2019, the Energy Freedom Act, led the Public Service Commission of South Carolina to approve "Solar Choice" tariffs for Duke Energy and Dominion Energy South Carolina, generally time-of-use based. South Carolina also offers a state income tax credit of 25 percent of system cost, capped at $3,500 per year or 50 percent of tax liability, with unused amounts carried forward up to 10 years.
Market notes
The Carolinas are growing fast, with new-build suburbs around Charlotte, Raleigh, Greenville and Charleston. Per-lead prices are moderate. Time-of-use rates make battery sizing and load-shifting part of the pitch, so reps need to explain them simply.
Carolinas buying checklist
- Prepare a one-minute time-of-use explanation.
- In South Carolina, lead with the state tax credit.
- Separate Duke, Dominion and co-op territories in reporting.
Georgia: is Georgia a value market or a trap?
Georgia solar leads cost $45 to $85 per lead according to LeadGen Economy (April 2026); SolarReviews lists $483 per sale on defined sources and $400 on lower-quality ones. Georgia has strong sun, fast growth and rising rates, but limited net metering and no state tax credit hold back the savings case.
Export compensation
Georgia Power, regulated by the elected Georgia Public Service Commission, credits most residential exports at a rate based on avoided cost rather than retail, with a limited number of customers allowed monthly netting under a program the PSC approved in 2019. Electric membership co-ops, which serve a large share of Georgia, and municipal systems set their own rules.
Market notes
Georgia's rates rose from 15.56 to 16.27 cents per kWh year over year per EIA, and Georgia Power has had multiple approved rate increases in recent years. Atlanta's suburbs are the volume center. Because exports earn less than retail, Georgia pitches are about self-consumption and batteries. SolarReviews shows lower-quality sources slightly cheaper per sale than defined sources, an oddity that may reflect small sample sizes. Treat Georgia as a test market, not a proven one.
Georgia buying checklist
- Capture Georgia Power vs EMC vs municipal utility at intake, because export terms differ.
- Lead with summer bill size and recent rate increases rather than export credits.
- Pitch self-consumption and batteries; size systems around daytime use.
- Start with a small test in the Atlanta suburbs, and judge on cost per sale after 30 to 60 days of lead age.
- Compare Georgia results with an adjacent state where you already install before adding volume.
Why the Georgia data deserves caution
The two published sources point in different directions for Georgia. LeadGen Economy's per-lead range is moderate, while SolarReviews shows lower-quality sources slightly cheaper per sale than defined ones, which is the opposite of most states. When sources disagree like this, your own test data matters more than either table. Keep the first batch small and record every funnel step so you have a clean read.
Hawaii: why are Hawaii solar leads the most expensive per lead?
Hawaii solar leads cost $200 to $350+ per lead according to LeadGen Economy (April 2026), the highest range in its table, while SolarReviews lists $563 per sale on defined sources. Hawaii has the highest residential rates in the country, no retail net metering for new customers, and a market built around batteries.
Export compensation
The Hawaii Public Utilities Commission closed net energy metering to new Hawaiian Electric customers in October 2015 and replaced it with options such as Customer Self-Supply, where exports are not compensated, and Customer Grid Supply, where exports are credited at fixed rates. Later programs, including Smart Export and the Battery Bonus incentive, pushed new systems toward storage and timed exports. Kauai is served by a co-op, KIUC, with its own rules.
Incentives that remain
Hawaii's renewable energy technologies income tax credit is 35 percent of the cost of a residential solar system, capped at $5,000 per system, under Hawaii Revised Statutes section 235-12.5. That is the largest per-system state credit among the states profiled here.
Market notes
EIA's preliminary July 2026 figure for Hawaii was 48.00 cents per kWh, more than two and a half times the national average. That supports the highest per-lead prices in the country, but the per-sale figure from SolarReviews is far below California's, which suggests close rates in Hawaii are high once you reach a homeowner. Logistics matter: shipping, inter-island travel and limited crews raise installation cost. Only installers already operating in Hawaii should buy Hawaii leads.
Do lead costs differ by utility within the same state?
Yes. In most large solar states, export credits, rate levels and incentives differ by utility, so two homeowners in one state can have very different savings cases. California IOU vs LADWP, Arizona APS vs SRP and Texas competitive-market vs Austin Energy are the clearest cases. Buy and report by utility, not just by state.
Common splits inside a state
| State | Split | What differs |
|---|---|---|
| California | PG&E, SCE, SDG&E vs LADWP, SMUD and other munis | Net billing applies to IOUs; munis set their own export and rate rules |
| Arizona | APS and TEP vs SRP | ACC export rate vs SRP's own price plans, some with demand charges |
| Texas | Competitive retail areas vs munis and co-ops | Export credit depends on retail plan in competitive areas; munis set their own |
| Florida | FPL, Duke, TECO vs JEA, OUC and co-ops | IOU net metering rule vs local terms |
| New York | Upstate IOUs vs PSEG Long Island and munis | PSC rules vs LIPA tariffs |
| Massachusetts | Eversource, National Grid, Unitil vs municipal light plants | Lower rates and different rules in many munis |
| Colorado | Xcel vs munis and co-ops | Retail net metering at Xcel; local terms elsewhere |
| North Carolina | Duke vs Dominion NC vs EMCs | Different time-of-use and netting rules |
How to use utility data
- Ask your vendor whether utility is captured at intake. If not, have reps ask it in the first 30 seconds.
- Build your cost-per-sale report with a utility column. After 50 to 100 leads per utility you can see whether one group is dragging your numbers down.
- Adjust ZIP filters to drop or deprioritize utility territories that underperform.
- Map each utility's export rule to a short talk track so reps do not have to improvise.
Finding utility service territories
EIA publishes data on which utilities serve which areas through its Form EIA-861 data, and many state commissions publish service territory maps. For ZIP-level filtering, your vendor's own utility field is usually more practical. If a ZIP is split between two utilities, ask whether the vendor resolves it by address or leaves it blank.
How do you research a state's solar economics yourself?
You can check any state's solar economics in about an hour using four free public sources: EIA for rates, DSIRE for incentives and net metering, the state utility commission for current rules and pending changes, and LBNL's Tracking the Sun for installed prices. The steps below show what to pull from each and how to turn it into a buy decision.
Step 1: Pull the rate and its trend from EIA
Open the EIA Electric Power Monthly Table 5.6.A and note the residential price for the latest month and the same month a year earlier. Then check the EIA state electricity profile for the annual average, which smooths out seasonal swings. Write down three numbers: the latest month, the year-ago month and the annual average.
What to look for: a state above the national average gives you a stronger savings pitch; a state with a double-digit year-over-year increase gives reps a timely reason to call.
Step 2: Read the DSIRE summary
Search the state on DSIRE. Open the net metering entry, every residential financial incentive and any interconnection standard. Note the "last updated" date on each entry. DSIRE is a summary maintained by a research center, so use it to find programs, then confirm details at the source it links.
What to look for: whether exports earn retail, a fixed rate or avoided cost; whether there is a state tax credit, rebate or performance payment; whether utilities or munis have separate programs.
Step 3: Check the regulator's docket for pending changes
Go to the state utility commission's site and search open dockets for "net metering," "distributed generation," "net billing" or "value of solar." Read the most recent order or the procedural schedule. You are looking for one thing: is a rule change likely in the next 12 months that would apply to new customers?
What to look for: a pending decision with an effective date. A change can lower lead value overnight, as Nevada showed in 2015 and California in 2023. It can also create a rush of homeowners trying to beat a deadline, which temporarily lifts close rates.
Step 4: Check installed prices from LBNL
Lawrence Berkeley National Laboratory's Tracking the Sun reports installed prices for residential systems by state. Its data lags the market by a year or more, so use it for relative comparisons between states rather than current pricing. Compare it with your own contracts.
Step 5: Pull the two published lead price sources
Use the state table earlier in this guide: LeadGen Economy for a per-lead range and SolarReviews for cost per sale. Note which columns are per lead and which are per sale. If a state is missing from one source, say so in your notes rather than guessing.
Step 6: Write a one-page state brief
| Field | Your entry |
|---|---|
| Residential rate, latest month and year ago (EIA) | |
| Export compensation for new customers | |
| State incentives still open | |
| Pending regulatory changes and dates | |
| Main utilities and munis or co-ops | |
| Published per-lead range (source, date) | |
| Published per-sale figure (source, date) | |
| Your assumed funnel rates | |
| Your gross margin per job in this state | |
| Break-even cost per lead | |
| Decision: test, wait or skip |
Keep the brief in a shared folder and update it each quarter. The point is to make the buy decision from written facts rather than from a vendor's pitch.
How do you score and rank states for a lead budget?
Score each candidate state on five weighted factors, savings case, policy stability, competition, operational fit and published cost per sale, then rank by total score and test the top two or three. A scoring matrix keeps the decision consistent across your team and makes it easy to revisit when a state's rules change.
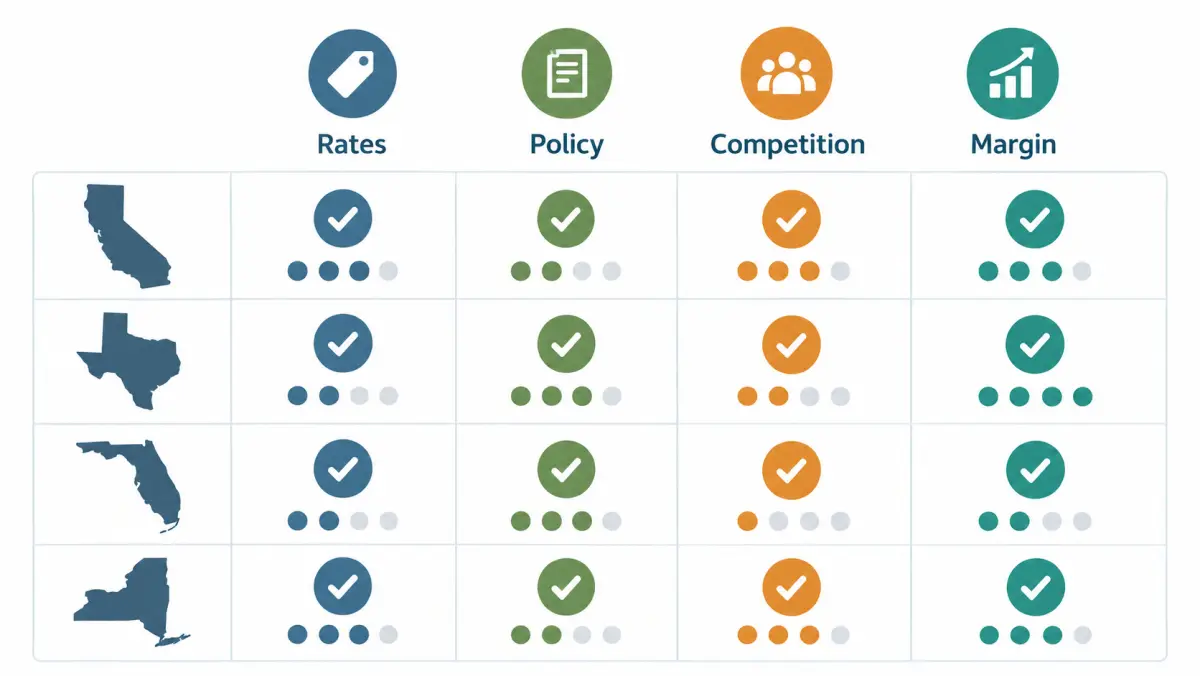
The five factors
| Factor | What to score (1 to 5) | Suggested weight |
|---|---|---|
| Savings case | Rate level and trend from EIA; export credit quality | 25% |
| Policy stability | Pending dockets, recent changes, sunset dates on incentives | 15% |
| Competition | Installer density, door-to-door activity, shared lead resale | 20% |
| Operational fit | Your crews, licensing, permitting speed and travel time | 25% |
| Published cost per sale | SolarReviews per-sale figure relative to your margin | 15% |
Operational fit carries as much weight as the savings case on purpose. A great state you cannot install in quickly will lose to a decent state where your crews already work.
Illustrative scoring example
Illustrative example. Scores are assumptions for a hypothetical installer based in the Southeast with existing crews in Georgia and the Carolinas. Your scores will differ.
| State | Savings (25%) | Stability (15%) | Competition (20%) | Ops fit (25%) | Cost per sale (15%) | Weighted total |
|---|---|---|---|---|---|---|
| North Carolina | 3 | 3 | 4 | 5 | 4 | 3.85 |
| South Carolina | 3 | 4 | 4 | 4 | 3 | 3.60 |
| Georgia | 2 | 3 | 3 | 5 | 3 | 3.25 |
| Florida | 3 | 3 | 2 | 2 | 4 | 2.70 |
How the total is computed: multiply each score by its weight and add. For North Carolina, (3 × 0.25) + (3 × 0.15) + (4 × 0.20) + (5 × 0.25) + (4 × 0.15) = 0.75 + 0.45 + 0.80 + 1.25 + 0.60 = 3.85.
In this example the installer would test North Carolina first, South Carolina second and hold Florida until it has crews there. Note that Florida's savings case is not the issue; operational fit is.
Re-scoring triggers
Re-score a state when any of these happen:
- The regulator issues a final order changing export compensation for new customers.
- A state incentive opens, closes or changes its value.
- EIA data shows a rate change of 10 percent or more year over year.
- Your own cost per sale in the state moves 25 percent or more over a full month.
- You add or lose crews in the state.
How should installers of different sizes approach state selection?
Small installers should go deep in one or two states where they already install. Mid-size installers can run controlled tests in two to four states. Multi-state operators should manage states as a portfolio, shifting budget monthly by cost per sale. The right number of states depends on how many leads you can work fast, not on your ambition.
Scenario 1: one-crew local installer
Illustrative scenario. A one-crew installer in central Pennsylvania closes four to six jobs a month and has one salesperson who also runs site visits.
- State choice: stay home. Pennsylvania's published figures are modest ($50 to $90 per lead, $360 per sale on defined sources), and rates rose sharply year over year per EIA. There is no reason to add a second state.
- Volume: buy only as many leads as one person can call within five minutes during business hours. For many one-person teams that is five to ten exclusive leads a week.
- Filters: tight ZIP radius around the shop, to keep site visit travel low.
- Risk: a few bad weeks can look like a bad market. Judge on 30 to 60 days of results, not one batch.
Scenario 2: regional installer expanding across a state line
Illustrative scenario. A five-crew installer in North Carolina wants to add South Carolina.
- State choice: South Carolina is a natural adjacent market with a state tax credit and similar Duke Energy rate design. The SolarReviews per-sale figure is higher ($613 vs $363), so expect a higher cost per sale at first.
- Test design: keep North Carolina at its current volume as the control. Buy a fixed number of South Carolina leads in two metros near existing crews for six weeks.
- Licensing: confirm contractor and electrical licensing in the new state before buying a single lead. Leads you cannot legally install are pure waste.
- Decision rule: continue if South Carolina cost per sale is within 25 percent of North Carolina's after six weeks; otherwise pause and adjust filters.
Scenario 3: multi-state operator managing a portfolio
Illustrative scenario. A company installs in Texas, Arizona, Florida and Colorado.
- Portfolio view: set a monthly budget per state and move 10 to 20 percent of total budget each month from the worst cost-per-sale state to the best, within crew capacity.
- Seasonality: Florida storm season, Arizona and Texas summer bill shock and Colorado's shorter install season all shift the best month for each state. Plan the calendar, not just the totals.
- Reporting: cost per sale by state, utility and lead type, refreshed weekly.
- Policy watch: one person owns the regulatory calendar for all four states and flags pending changes.
Scenario 4: installer focused on solar-plus-storage
Illustrative scenario. A storage-focused installer wants markets where batteries are part of most sales.
- State choice: California (net billing), Hawaii (no retail export credit for new customers), Arizona SRP territory (demand charges) and Connecticut (storage incentives) all favor batteries. Texas and Florida have reliability-driven demand.
- Lead type: ask vendors for a battery-interest field and buy it as a filter where available.
- Economics: higher job values can support higher lead prices. Run the margin math with storage-specific close rates; they are often lower than solar-only at first contact but produce larger contracts.
Scenario 5: new installer with no track record
Illustrative scenario. A new company with licensed crews and no historical funnel data.
- State choice: your home state only.
- Lead type: exclusive leads or booked appointments, because a new team rarely wins speed races on shared leads. See solar appointments and exclusive solar leads.
- Budget: fund a full test of at least 60 to 90 days so you have enough sales to read cost per sale.
- Measurement: track every lead from delivery to sale from day one. Without that data you cannot compare states later.

How do you split a lead budget across states?
Split a multi-state lead budget by break-even cost per lead, not by population or by the published price range. Work out what you can pay per lead in each state from your margin and funnel, fund the states with the most headroom first, cap each by crew capacity, and hold back 10 to 20 percent for tests and spikes.
Step 1: Compute break-even cost per lead by state
Break-even cost per lead = (target lead cost per sale) × (lead-to-sale rate).
Your target lead cost per sale is the share of gross margin you are willing to spend on leads. Many installers think about it as a percentage of margin, for example 25 to 40 percent; pick your own number from your overhead and profit goals. The lead-to-sale rate is contact rate × appointment rate × sit rate × close rate.
Illustrative example with assumed inputs.
| Input | State A (high-rate Northeast) | State B (Sun Belt metro) | State C (Midwest) |
|---|---|---|---|
| Gross margin per job | $8,000 | $6,000 | $5,500 |
| Target lead share of margin | 35% | 35% | 35% |
| Target lead cost per sale | $2,800 | $2,100 | $1,925 |
| Lead-to-sale rate | 5.0% | 4.0% | 6.0% |
| Break-even cost per lead | $140 | $84 | $115.50 |
Now compare break-even with what you are quoted. If State A leads are quoted near the LeadGen Economy range for a premium Northeast state, $150 to $275, the break-even of $140 says you need a better funnel or a bigger margin to make it work. State C's quoted price might be well below its $115.50 break-even, giving room to buy more. These figures are illustrative; plug in your own.
Step 2: Rank by headroom
Headroom = break-even cost per lead − quoted price per lead. Fund the state with the most headroom first. If headroom is negative, the state is not ready, regardless of how attractive its rates look.
Step 3: Cap by capacity
Each state's monthly lead volume is capped by:
- the number of leads your reps can call within five minutes,
- the number of appointments your closers can run,
- the number of installs your crews can complete without pushing timelines past 60 to 90 days.
A long install backlog raises cancellations, which raises your real cost per sale. Do not buy more than you can install.
Step 4: Reserve a test budget
Hold 10 to 20 percent of the monthly budget for a test state or for a spike in a state that is working. A reserve lets you act on a rate jump or a pending deadline without cutting a state that is performing.
Step 5: Rebalance monthly
At month end, recompute cost per sale for each state, using only leads old enough to have closed or been lost (often 30 to 60 days). Move budget from the worst state to the best within capacity limits. Keep a log of each change and why, so you can see later whether the move paid off.
Budget template
| State | Break-even CPL | Quoted CPL | Headroom | Capacity (leads/month) | Budget this month | Last month cost per sale | Notes |
|---|---|---|---|---|---|---|---|
| Test reserve |
The solar lead ROI guide goes deeper on the cost-per-sale math, and the cost calculator runs it for you.
What should your reps say differently in each state?
Reps should change three things by state: the opening reason for the call, the export-credit explanation and the incentive mention. The rest of the call, discovery, qualification and setting the appointment, can stay the same. Short, accurate state lines prevent reps from repeating outdated claims about the 25D credit or net metering.
Rules for every state
- Never mention the federal 25D credit as available for a new purchase. It ended for systems placed in service after December 31, 2025.
- Never promise a specific savings number on the first call. Savings depend on usage, roof, rate plan and export rules.
- Never state a tax outcome for the homeowner. Say "your tax advisor can confirm how this applies to you."
- Confirm the homeowner's utility before explaining export credits.
- Update the lines below when a regulator changes a rule. Keep a dated version history.
Opening lines by state type
Example scripts. Adapt to your company and confirm every policy line before use.
High-rate state with rising bills (for example New York, Massachusetts, California):
"Hi [name], this is [rep] with [company]. You asked about solar for your home on [date]. A lot of folks in [town] have seen their electric bills go up this past year, so I wanted to see what's prompting you to look now."
Sun Belt state with reliability concerns (for example Texas, Florida):
"Hi [name], this is [rep] with [company]. You asked about solar for your home. Some people we talk to are mainly after a lower bill, and some want backup power when the grid goes down. Which matters more to you?"
Lower-rate state (for example Nevada, Utah, Georgia):
"Hi [name], this is [rep] with [company]. You asked about solar. Before I get into anything, can I ask what your summer bills look like? That tells me pretty quickly whether this makes sense for you."
Export-credit explanations
| Rule type | Plain-language line (example) | States where it applies |
|---|---|---|
| Retail net metering | "When your panels make more than you use, the extra goes to the grid and you get credit on your bill at about the same rate you pay." | Florida IOUs, New Jersey, Massachusetts small systems, Colorado Xcel, Pennsylvania, Maryland |
| Net billing or export rate below retail | "Power you use from your panels saves you the full rate. Power you send back earns less, so we size the system around what you use, and a battery can store the extra for the evening." | California IOUs, Arizona APS and TEP, Utah, Georgia, Nevada (at a percentage of retail) |
| Supply-only credit plus rebate | "Exports are credited for the energy part of your rate, and the utility pays a rebate upfront based on system size." | Illinois new customers |
| Fixed long-term tariff | "The program pays a fixed rate for a set number of years, so you know what you'll get." | Connecticut RRES, New Jersey SREC-II (performance payment) |
| Retail plan dependent | "In your area, what you get for extra power depends on your electricity plan. Some plans pay for it and some don't, so we'll look at yours." | Texas competitive areas |
| Time-of-use | "Your rate changes by time of day. Panels plus a battery can help you avoid the most expensive hours." | North and South Carolina Duke territories |
These lines simplify on purpose. Each must be checked against the current rule for the homeowner's utility, and the profiles above note where details still need verification.
Incentive mentions
- New York: "New York has a state tax credit for solar, and NYSERDA has an incentive that lowers the price. We'll show both in your proposal."
- South Carolina: "South Carolina has a state income tax credit for solar. Your tax advisor can confirm how it applies to you."
- Hawaii: "Hawaii has a state tax credit for solar systems. We'll walk through it with the proposal."
- Arizona: "Arizona has a small state tax credit for solar."
- Massachusetts: "Massachusetts has a state program that pays for the power your system produces, plus a small state tax credit."
- Illinois: "Illinois Shines lowers the upfront price through state renewable energy credits."
- Texas and Florida: "Your state doesn't add property tax for the value solar adds to your home."
Handling "I heard solar incentives ended"
"You're right that the federal homeowner tax credit ended at the end of 2025. What's left depends on your state and utility. In [state], [incentive or export rule] still applies, and in a lot of cases rising bills matter more than the credit did. I can show you the numbers without the federal credit so you see the real picture."
Our guide to solar leads after 25D has more on post-credit messaging.
Why did my cost per sale jump in one state?
A sudden rise in cost per sale in one state usually has one of five causes: a policy change for new customers, a rate change, a competitor surge, a vendor source change or an internal problem such as slower speed to lead. Check them in that order, because the first two are public and quick to confirm.
Troubleshooting table
| Symptom | Likely cause | How to check | What to do |
|---|---|---|---|
| Close rate drops across the state at once | Export rule or incentive changed for new customers | Regulator docket; program administrator site; DSIRE update date | Update scripts and proposals; recompute break-even; reduce volume until the new rate holds |
| Appointment rate drops but close rate holds | Leads less motivated; seasonal dip; falling rates | EIA month-over-month rate; your own seasonal history | Lower volume; shift budget to a state in season |
| Contact rate drops sharply | Leads resold or canvassed by others; caller ID labeled spam | Ask vendor how many buyers; check number reputation; test a fresh caller ID | Switch to exclusive; register numbers; add text first-touch with consent |
| One utility territory underperforms | Muni or co-op with weaker export terms | Report by utility | Filter out or price separately |
| Many leads "already have quotes" | Competitor ad campaign or door-to-door push | Rep notes; share of leads mentioning other installers | Speed up first call; strengthen proposal; consider booked appointments |
| Cancellations rise after signing | Install backlog, financing denials, rate change news | Days from sale to install; financing approval rate | Cap volume to crew capacity; prequalify financing earlier |
| Cost per sale up but nothing changed outside | Internal: rep turnover, slower response | Median minutes to first call; rep-level close rates | Fix staffing before blaming the state |
A 30-minute state diagnosis
- Pull 60 days of leads for the state, split into two 30-day halves.
- Compare each funnel rate: contact, appointment, sit, close.
- Find the rate that moved most. That points to the cause in the table above.
- Check the regulator and EIA for changes in the same window.
- Ask the vendor whether its source mix or buyer count changed.
- Write one paragraph on what you found and what you will change. Review it in 30 days.
What about the Pacific Northwest, Midwest and Plains states?
The Pacific Northwest, Upper Midwest and Plains are low-to-moderate cost lead markets. LeadGen Economy lists Washington and Minnesota at $40 to $70 per lead, Oregon at $45 to $75, and much of the Plains at $15 to $60 (April 2026). Lower rates and lower installer density keep prices down, but close rates and job values are lower too.
Pacific Northwest
Washington and Oregon have relatively low residential rates in many areas because of hydropower, which narrows the savings case. Both states have net metering for most utilities, and Oregon has run a state solar and storage rebate program through the Oregon Department of Energy. Washington has many public utility districts with their own rules, so utility capture is important. SolarReviews lists Oregon at $414 per sale and Washington at $483 on defined sources, which is moderate. Cloudier winters mean production is seasonal, and reps should expect questions about it.
Upper Midwest
Minnesota has a relatively active market, with Xcel Energy as the main utility and a history of community solar. SolarReviews lists Minnesota at $650 per sale on defined sources and $900 on lower-quality ones, higher than its per-lead range suggests. Michigan, Wisconsin, Ohio and Indiana sit at $25 to $65 per lead in LeadGen Economy's table and $300 to $450 per sale in SolarReviews' defined-source column. Several of these states have moved away from full retail net metering for new customers at some utilities. Check DSIRE and the state commission for each utility.
Plains and Mountain West
North Dakota, South Dakota, Nebraska, Kansas, Montana and Wyoming have the lowest per-lead prices in LeadGen Economy's table, $15 to $55. Populations are small and spread out, electric co-ops and public power serve large areas, and rates are low. Ground-mount systems on farms and ranches are a meaningful share of demand, and agricultural customers may have different financing and use cases. Travel time per site visit is a real cost.
Illustrative example: rural ground-mount math
Illustrative example with assumed inputs. A Plains installer pays $40 per lead, reaches 75 percent of leads, sets appointments with 40 percent of contacts, sits 85 percent and closes 30 percent of sits.
- Leads per sale: 1 ÷ (0.75 × 0.40 × 0.85 × 0.30) = 1 ÷ 0.0765 = about 13 leads.
- Lead cost per sale: 13 × $40 = about $520.
- Add travel: if each site visit costs $150 in fuel and time and it takes about 3.3 sat appointments per sale (1 ÷ 0.30), travel adds roughly $500 per sale.
In this example travel costs about as much per sale as the leads do. Rural markets reward remote consultations, satellite roof and site assessment, and grouping visits by area. Contact rates in less-canvassed areas can be higher than in crowded metros, which is part of why these markets can work for local installers.
Pacific Northwest buying notes
- Capture utility at intake; Washington has many public utility districts with their own rules.
- Set expectations about winter production honestly; annual totals matter more than any single month.
- Use incentive programs only when you have confirmed they are funded and open.
- Expect longer research cycles and send useful follow-up information between calls.
When these markets make sense
- You already install there and want steady, low-cost volume.
- You sell ground-mount or agricultural systems where job values are higher.
- You have a remote sales process (video consultations, remote site surveys) that keeps travel cost low.
They rarely make sense as an expansion target for an installer based elsewhere, because travel and crew logistics eat the lower lead cost.
What questions should you ask a lead vendor about a specific state?
Ask a vendor six state-specific questions before buying: can you filter by utility, how many buyers get each lead in this state, what is the source mix here, how is consent captured and named, what replacement terms apply, and what volume can you deliver weekly in my ZIPs. The answers tell you more about cost per sale than the quoted price.
The questions
- Utility filter: "Do you capture utility at intake for [state], and can I filter by it?" Critical in California, Arizona, Texas, Florida, New York and Massachusetts.
- Buyer count: "In [state], how many companies receive each shared lead, and is the exclusive product sold once?" Our exclusive leads are sold to one company and never resold, recycled or sold later as aged leads.
- Source: "Where do [state] leads come from: search, social, comparison sites, call centers? Has the mix changed in the last 90 days?"
- Consent: "Can you show me a consent record for a [state] lead, with the timestamp and disclosure that names my company?" Confirm calling and texting rules for the state with counsel; several states have their own telemarketing laws on top of federal rules.
- Replacements: "What's replaceable and in what window?" Our replacement credits cover disconnected numbers, wrong contact details, or leads outside your filters, reported within 7 days. Not covered: a prospect who isn't interested, doesn't answer, doesn't get financing approved, or doesn't buy.
- Volume: "How many leads per week can you deliver in these ZIPs, and does that change by season?"
State-specific follow-ups
| State | Follow-up question |
|---|---|
| California | "Is battery interest captured, and how is the question worded?" |
| Arizona | "Can you separate SRP from APS and TEP?" |
| Texas | "Is retail electric provider captured, or only the wires utility?" |
| Florida | "Is roof age captured?" |
| New York | "Can you split Long Island, NYC and upstate?" |
| Massachusetts | "Are municipal light plant ZIPs excluded or flagged?" |
| Illinois | "Do you screen for ComEd vs Ameren?" |
| Hawaii | "Which islands do you cover?" |
The vendor vetting guide covers general checks and red flags.
Which state policy dates should a lead buyer track?
Track four kinds of dates for every state you buy in: regulator decisions on export compensation, incentive program step changes, legislative session calendars and utility rate case outcomes. A shared policy calendar lets you adjust budgets ahead of changes instead of discovering them in your close rates a month later.
The calendar fields
| Field | Example entry | Source to check |
|---|---|---|
| State | California | |
| Item | IOU fixed charge implementation | CPUC decision and utility notices |
| Type | Rate design | |
| Expected date | [date from decision] | |
| Effect on new customers | Lower volumetric rates; smaller per-kWh savings | |
| Action for us | Update proposal tool and rep talk track | |
| Owner | [name] | |
| Last checked | [date] |
Recurring items worth adding
- Legislative sessions: most state legislatures meet in the first half of the year. Net metering bills often appear, as Florida's 2022 HB 741 did. Check each state's session dates.
- Incentive blocks: NY-Sun Megawatt Blocks, Illinois Shines block capacity, California SGIP budget steps and New Jersey SuSI capacity all open and fill over time.
- Export rate resets: Arizona's export rate can step down annually for new customers; confirm when each step takes effect.
- Rate cases: utility rate cases set base rates for years. An approved increase gives reps a reason to call.
- Federal changes: any change to federal treatment of third-party-owned systems affects lease and PPA offers in every state. Confirm with a tax advisor.
How often to check
Check monthly for states where you buy every week. Check quarterly for states you are only watching. Set a calendar reminder, because a policy change usually shows up in your numbers about 30 to 60 days after it takes effect, by which point you have already paid for the leads.
State quick-reference summary
This summary condenses the profiles above into one table. Published prices come from the two sources in the main state table and are not our pricing. Export rules are simplified and should be confirmed for each utility before use; pricing for your territory is confirmed by ZIP on your call.
| State | Per-lead range (LeadGen Economy, Apr 2026) | Per sale, defined source (SolarReviews) | Export rule for new customers (simplified) | Main remaining state incentive | Biggest lead-buying risk |
|---|---|---|---|---|---|
| California | $175 to $300+ | $1,929 | Net billing at IOUs | SGIP storage | Crowded market, source quality |
| Texas | $100 to $175 | $557 | Depends on retail plan or muni | Property tax exemption | Speed to lead, shared lead competition |
| Florida | $100 to $175 | $488 | Retail net metering at IOUs | Sales and property tax relief | Consumer wariness, storm seasonality |
| Arizona | $80 to $150 | $613 | Export rate (APS, TEP); SRP plans | 25% credit up to $1,000 | Utility mix, source quality |
| Nevada | $50 to $90 | $483 | Credit at 75% of retail | Limited | Policy history, low rates |
| Utah | $45 to $80 | $700 | Export credit below retail | Expired state credit | Low per-lead price, high per-sale cost |
| Colorado | $90 to $160 | $557 | Retail net metering at Xcel | Sales tax exemption | Muni and co-op splits |
| New York | $150 to $250 | $1,357 | Net metering with CBC charge | 25% credit up to $5,000; NY-Sun | Regional differences, source quality |
| New Jersey | $100 to $175 | $1,400 | Retail net metering | SREC-II for 15 years | Sophisticated, quoted-out buyers |
| Massachusetts | $150 to $275 | $1,400 | Net metering at IOUs | SMART; 15% credit up to $1,000 | Roof and shade, muni territories |
| Connecticut | $100 to $175 | $1,286 | RRES buy-all or netting | Storage incentives | Falling rates in 2026 snapshot |
| Illinois | $50 to $90 | $360 | Supply-only credit plus DG rebate | Illinois Shines | Vendor approval requirements |
| North Carolina | $50 to $95 | $363 | Time-of-use netting at Duke | Utility programs | Rate design complexity |
| South Carolina | $45 to $85 | $613 | Solar Choice tariffs | 25% credit, capped | Higher per-sale than NC |
| Georgia | $45 to $85 | $483 | Mostly avoided-cost exports | None statewide | Weaker savings case |
| Hawaii | $200 to $350+ | $563 | No retail export credit; DER tariffs | 35% credit up to $5,000 | Logistics, island coverage |
| Pennsylvania | $50 to $90 | $360 | Retail net metering | None large | Lower brand awareness of solar |
| Maryland | not listed | $1,333 | Retail net metering under cap | State rebate | Premium per-sale cost |
Glossary of state solar terms
Avoided cost: the cost a utility avoids by not generating or buying a unit of energy. Some states credit solar exports at avoided cost, which is usually well below retail.
Buy-all tariff: a program where all of a system's production is sold to the utility at a fixed rate, and the home buys all its power at normal rates. Connecticut's RRES offers one.
Customer Benefit Contribution (CBC): a monthly charge in New York for mass-market solar customers interconnected from 2022, based on system size.
Demand charge: a charge based on a customer's highest power draw in a billing period rather than total energy. Some Arizona SRP plans have used them.
DER tariff: a utility tariff for distributed energy resources such as rooftop solar and batteries, common in Hawaii.
Distributed generation rebate: an upfront payment based on system size, used in Illinois alongside supply-only export credits.
Export rate: the price paid for energy a system sends to the grid. Can equal retail (net metering) or be lower.
Investor-owned utility (IOU): a privately owned utility regulated by the state commission. Municipal utilities and co-ops are often outside commission rules.
Lead cost per sale: total lead spend divided by sales. The number that matters for profitability. Not the same as price per lead.
Municipal light plant / muni: a city-owned utility. Massachusetts has dozens; California, Texas and Colorado have large ones.
Net billing: a system where self-consumed energy offsets retail and exports are credited at a lower value, as in California's NBT.
Net metering: a system where exports are credited at or near the retail rate, usually with monthly carryover.
Public utility commission (PUC or PSC): the state body that regulates IOU rates and rules. Names vary: CPUC, PUCT, Florida PSC, ACC.
Renewable energy credit (REC) / SREC: a certificate representing one megawatt-hour of renewable generation. Some states pay for SRECs as an incentive.
Retail electric provider: in Texas competitive areas, the company that sells electricity and sets export credit terms. Separate from the wires utility.
Time-of-use (TOU) rate: a rate that changes by time of day, usually highest in late afternoon and evening.
Value of solar: a tariff that pays a calculated value per kWh of solar production. Austin Energy is the best-known example.
How does seasonality differ by state?
Solar lead demand peaks at different times in different states. Sun Belt states peak with summer bills, Florida swings with hurricane season, Texas spikes after grid emergencies, and the Northeast and Midwest compress installs into the warmer months. Plan budgets by state and month rather than by a single annual average.
Seasonal patterns to plan around
| Region | Typical demand drivers | Planning note |
|---|---|---|
| Arizona, Nevada, inland California | Summer air-conditioning bills | Inquiries rise in late spring as bills climb; plan crew capacity for summer heat limits on rooftop work |
| Texas | Summer bills; winter and summer grid emergencies | Keep a reserve budget for post-event spikes; staff for speed when news hits |
| Florida | Hurricane season, June 1 to November 30 | Expect bursts of backup interest after storms; post-storm roof and insurance issues slow installs |
| Northeast | Winter heating and summer bills; short install season | Sell in winter and spring for warm-season installs; snow delays site visits |
| Upper Midwest and Plains | Short install season | Front-load buying in late winter and spring; slow down in late fall |
| Hawaii | Fairly steady year round | Constraint is crew and shipping logistics more than season |
These patterns are general. Your own data is the best guide after a full year. Record cost per sale by month and state so the second year's plan is based on your numbers.
Seasonality and published prices
Neither published source in our state table breaks prices out by month. LeadGen Economy gives a single range per state and SolarReviews a single per-sale figure. If a vendor quotes you a different price in different months, ask why and what changes in the lead.
Illustrative walkthrough: rebalancing a two-state budget
This walkthrough shows how a hypothetical installer working in California and Texas used the steps in this guide to rebalance its lead budget. All numbers are assumptions for illustration. They are not market data, not results from a real company and not our pricing.
The starting point
Illustrative. The company spends an equal amount each month on exclusive leads in Southern California and the Dallas-Fort Worth area. Over 90 days its reports show:
| Metric | Southern California (assumed) | Dallas-Fort Worth (assumed) |
|---|---|---|
| Price per lead | $240 | $130 |
| Lead-to-sale rate | 6.0% | 5.0% |
| Lead cost per sale | $4,000 | $2,600 |
| Average gross margin per job | $9,500 (mostly solar plus storage) | $6,200 (mostly solar only) |
| Lead cost as share of margin | 42% | 42% |
At first glance, Texas looks cheaper per sale. But lead cost takes the same share of margin in both states, so neither is clearly better on that measure.
What the diagnosis found
- Utility split in California: a third of California leads were in a municipal utility territory with lower rates, and those leads closed at about half the rate of IOU leads. Excluding those ZIPs would raise the California lead-to-sale rate.
- Speed in Texas: median time to first call in Texas was 11 minutes, compared with 3 minutes in California, because the Texas team was smaller. Texas contact rates suffered.
- Product mix: Texas reps rarely pitched batteries, even though reliability was the most common reason Texas homeowners gave for inquiring.
The changes
- California: excluded the municipal utility ZIPs and kept total California spend flat, buying more IOU-territory leads.
- Texas: added one inside sales rep to bring median first-call time under 5 minutes, and added a backup-power question to the first-call script.
- Kept a 15 percent reserve for a post-storm spike in Texas.
The result after 60 more days
Illustrative. California's lead-to-sale rate rose to 7.0 percent, cutting lead cost per sale to about $3,430. Texas's rose to 6.0 percent, cutting lead cost per sale to about $2,170, and battery attach rose, lifting average margin. With better numbers in both states, the company moved part of its reserve into Texas, where headroom was now larger.
The lesson: neither state was "the cheap one." The state averages hid a utility split in one market and a staffing problem in the other. The published state tables are a starting point; your utility-level and rep-level data decide where the next dollar goes.
State buying checklist
Use this checklist before you add any state to your lead budget. It applies the steps in this guide in order.
- License check: confirm contractor and electrical licensing in the state.
- Crew check: confirm you can install within 60 to 90 days of sale in the target ZIPs.
- Rate check: pull the latest residential rate and year-ago rate from EIA.
- Policy check: read DSIRE's net metering and incentive entries, then confirm with the regulator or program administrator.
- Docket check: look for pending decisions on export compensation for new customers.
- Utility map: list the IOUs, munis and co-ops in your target ZIPs.
- Published prices: note the LeadGen Economy range and SolarReviews per-sale figure, labeled correctly.
- Break-even: compute your break-even cost per lead from margin and funnel assumptions.
- Vendor questions: ask the six state-specific questions above and get answers in writing.
- Scripts: write and approve state-specific opening, export and incentive lines; have counsel review calling and texting rules for the state.
- Test plan: set test size, duration (at least 30 to 60 days of lead age) and a stop rule.
- Reporting: set up cost per sale by state, utility and lead type before the first lead arrives.
If you want to talk through a state, book a call. Territory availability and pricing are confirmed by ZIP on your call, and there are no long-term contracts.
Methodology and sources
We built this guide from two public state-level datasets and primary sources for policy facts, all fetched in October 2026. We copied state values as published, labeled each column with its source's own definition, and flagged conflicts. We did not create, estimate or average any state figure.
Sources
- LeadGen Economy, "Solar Lead CPL by State", published December 25, 2025, updated April 21, 2026.
- SolarReviews, "How much do solar leads cost in each state?", Andy Sendy, undated.
- US Energy Information Administration, state electricity profiles.
- California Public Utilities Commission, net billing tariff.
- IRS, Residential Clean Energy Credit.
- Lawrence Berkeley National Laboratory, Tracking the Sun.
- US Energy Information Administration, Electric Power Monthly Table 5.6.A, preliminary July 2026 data, read October 2026.
- DSIRE, NC Clean Energy Technology Center.
- State regulators: Public Utility Commission of Texas, Florida Public Service Commission, Arizona Corporation Commission, Public Utilities Commission of Nevada, New York Department of Public Service, New Jersey BPU, Massachusetts DPU, Connecticut PURA, Illinois Commerce Commission, Colorado PUC, North Carolina Utilities Commission, Public Service Commission of South Carolina, Public Service Commission of Utah, Hawaii PUC, Georgia PSC, Virginia SCC, Maryland PSC, Pennsylvania PUC.
- Programs: CPUC SGIP, NYSERDA NY-Sun, New Jersey Clean Energy Program, Massachusetts SMART, Illinois Shines, EIA Form 861 utility data.
Limits
- Neither state dataset publishes sample sizes, collection dates per state, or the lead types included.
- The SolarReviews table may predate 2026 market changes.
- State averages hide big differences between metros and rural areas inside the same state.
- We have no first-party state data to publish yet. When we do, it will be labeled with dates and sample sizes.
FAQ
What is the average cost of a solar lead in Texas?
LeadGen Economy lists Texas solar leads at $100 to $175 per lead in its state table (updated April 2026), though its tier summary gives $75 to $150. SolarReviews reports $557 as lead cost per sale for multi-installer leads from a defined source in Texas, which is a per-sale figure, not a per-lead price.
Which state has the cheapest solar leads?
North Dakota and South Dakota have the cheapest published solar lead prices, at $15 to $35 per lead according to LeadGen Economy (April 2026). SolarReviews also ranks North Dakota lowest, at $225 lead cost per sale. Cheap leads in these states often come with lower close rates, so check cost per sale.
Why are solar leads so expensive in California?
California solar leads are expensive because electricity rates are high, job values are large, especially with batteries, and many installers compete for the same homeowners. LeadGen Economy lists $175 to $300+ per lead. The net billing tariff also requires leads screened for storage interest, which costs more to produce.
How much do solar leads cost per state?
Published per-lead ranges run from $15 to $35 in the Dakotas to $200 to $350+ in Hawaii, according to LeadGen Economy (April 2026). The full table above lists every state with both a per-lead range and SolarReviews' cost-per-sale figures, with each column labeled by its source's definition.
Is a lead in a high-cost state worth more?
A lead in a high-cost state is often worth more because job values and close rates can be higher. Whether it is worth the higher price depends on lead cost per sale compared with your gross margin per job in that state. Run the comparison with your own funnel rates before deciding.
How much should I spend per lead in Florida?
LeadGen Economy lists Florida at $100 to $175 per lead (April 2026), and SolarReviews reports $488 to $550 lead cost per sale for multi-installer leads. What you should spend depends on your margin per Florida job and your funnel rates. Work backward from an acceptable cost per sale.
Why does one source say California leads cost $1,929?
The $1,929 figure comes from SolarReviews and is labeled as the average lead cost per sale for multi-installer leads from a defined, organic source. It is the lead spend needed to produce one sale, not the price of a single lead. Many pages repeat it with the wrong unit.
Do you have your own state price list?
No. We do not publish a state price list. Prices depend on ZIP code, lead type and filters, so pricing is confirmed by ZIP on your call. Territory availability is confirmed by ZIP code on the same call, and there are no long-term contracts.
Should I buy shared leads in an expensive state to save money?
Shared leads in an expensive, crowded state are often called by several installers within minutes, which lowers your contact and close rates. The lower price can disappear in cost per sale. Shared leads in premium states work best for teams that call within a minute; slower teams usually do better with exclusive leads.